|
Today’s best setup explained: S&P, Nasdaq and Dow Jones [Video]
![Today’s best setup explained: S&P, Nasdaq and Dow Jones [Video]](https://editorial.fxsstatic.com/images/i/stock-02.jpg)
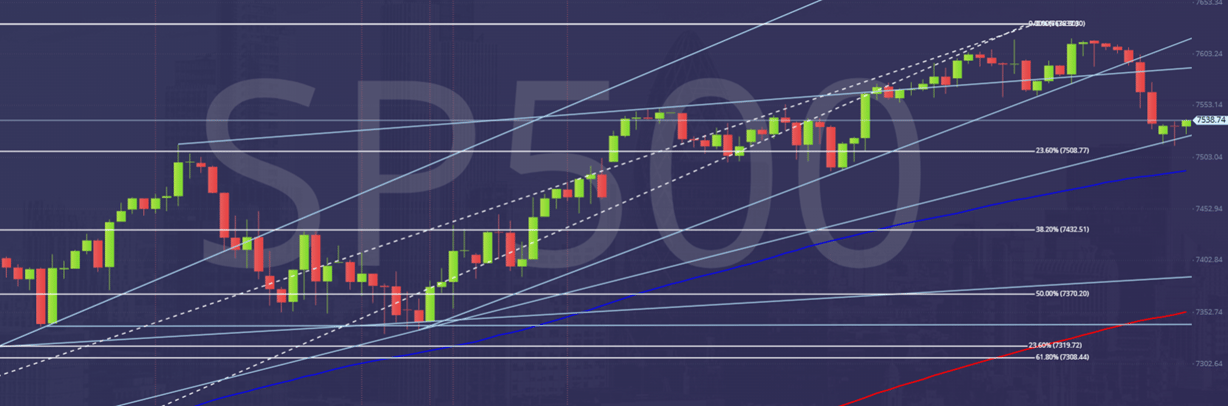
Emini S&P futures
- Emini S&P June futures we wrote: There is a good chance that we are about to establish a short term sideways trading range after such significant gains recently...A consolidation is normal, to ease overbought conditions.
- Good timing as we see the first down day for 11 sessions.
- But there is definitely no sell signal so I do not recommend gambling on a downturn at this stage.
- We broke minor support at 7575/7565 this time, to test better support at the previous all time high at 7540/7535.
- Longs need stops below 7530.
- A break lower however can target support at 7515/7505 & longs need stops below 7495.
- Just be aware that a break below here risks a slide to 7445/7440.
- If we happen to recover & break the all time high at 7632, look for 7640/50, perhaps as far as 7670/7675.
Nasdaq futures
- Emini Nasdaq June futures edged higher for a new all time high at
- 30807.
- There's a possibility that we form a sideways range to consolidate recent significant gains.
- Yesterday we did reverse & close lower on the day, so perhaps my timing is right & this is the start of a consolidation.
- However again, further gains are not out of the question with my next target of 30750/790.
- Short term support at 30310/270 & longs need stops below 30210.
- A break lower risks a slide to but below 30150/130, perhaps as far as support at 30000/29950 & longs need stops below 29850.
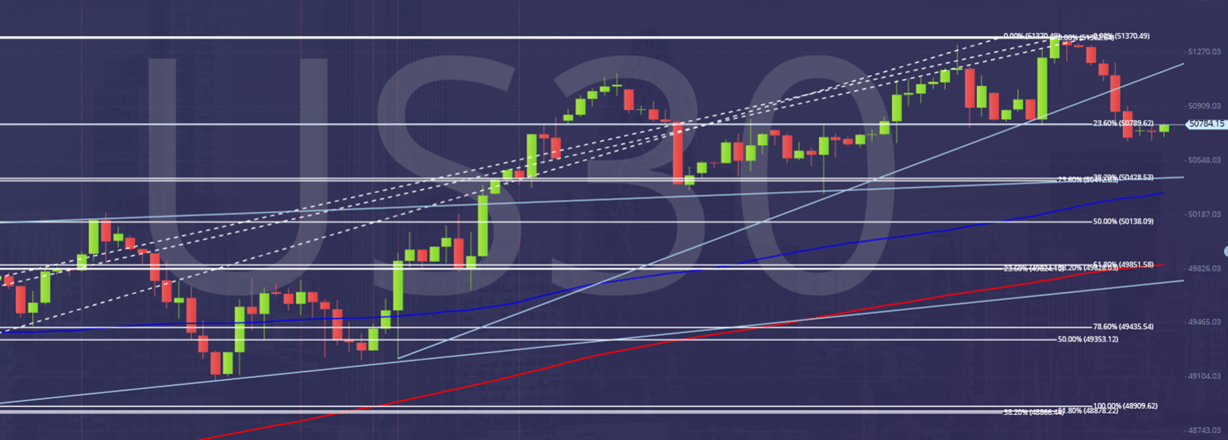
Emini Dow Jones futures
- Emini Dow Jones June collapsed from the new all time high at 51443.
- We are testing support again at 50920/50855 after we made a low for the day here on Tuesday, & longs need stops below 50720.
- A break lower can target support at 50550/480 & longs need stops below 50350.


Author

Jason Sen
DayTradeIdeas.co.uk
Jason Sen began his career in the options pits on the trading floor of LIFFE in 1987 at the age of 19, making markets on his own account. In 2001 when the trading floor closed he successfully made the transition to day trading on computer screens.
More from Jason Sen


