The world is short equities one way or another, but that's fuel for a rally

Although some market analysts don’t want to accept it, sometimes market positioning matters more than economic data or other fundamental factors. While this is truer in commodities, think crude oil and natural gas putting in tops last year at a time in which the fundamental narrative was the most bullish, it is almost as true in the stock and bond markets.
The simple reality is, if market participants have already reacted to a particular narrative to the extent, they are willing or capable, the trend exhausts itself and eventually reverses. These reversals can, and do, occur when they are least expected. Again, try to recall what most analysts were predicting for oil last year as it soared above $120.00 per barrel. I know of few that were calling for oil to print in the $60.00s; yet that is precisely what unfolded. At the time, consensus estimates were looking for $150.00 or higher. There were even a few bold calls for $200.00 oil. I’m not picking on these analysts, I get things wrong too, but the point is we shouldn’t allow the overwhelming public opinion to interfere with reality. In other words, what the majority believes will happen and what the market is capable of pricing in are two different things. If there aren’t enough oil consumers in the cash market and speculative buyers in the futures market, oil prices can retreat despite conventional wisdom. By the time oil reached $130.00 per barrel in 2022, cash market participants had hoarded the product they needed without regard to price, and speculators placed their wagers; but once those groups completed their tasks, there weren’t enough fresh buyers to keep prices afloat. Eventually, speculators liquidated their positions, and cash market buyers opted to run off their inventory rather than continue aggressive buying at high prices. Accordingly, the market price for oil declined by 50%!
We believe something similar can happen in the S&P 500, or more plainly the broad stock market. However, the price action will be bullish rather than bearish because futures speculators have already expressed their opinion on the market via a record large net short position. Further, by all accounts, investment portfolios are sitting on a historic amount of sidelined cash.
COT Report
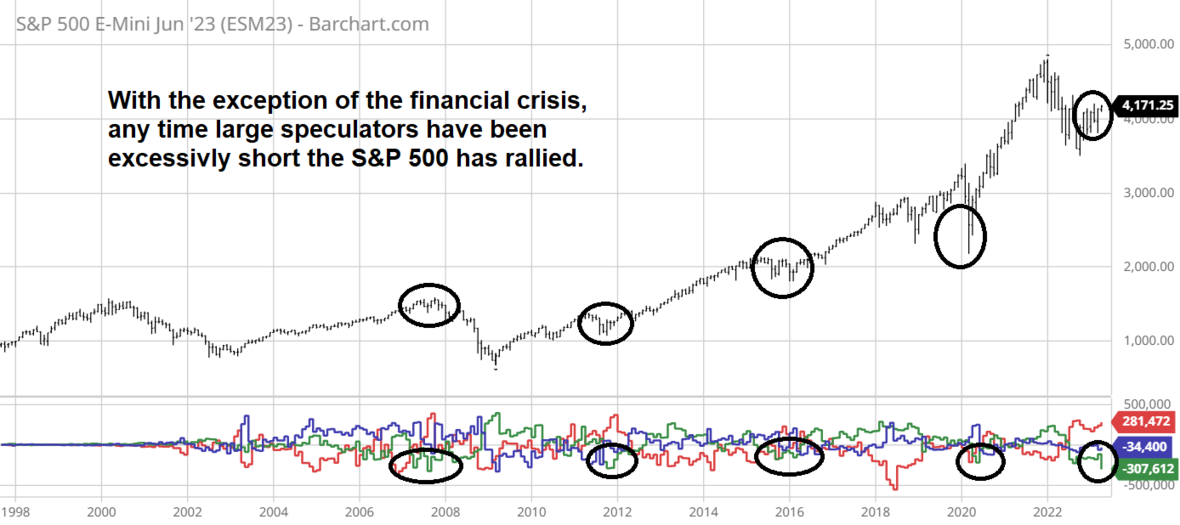
The latest COT Report (Commitment of Traders) issued by the CFTC (Commodity Futures Trading Commission) revealed that the Large Speculator group in the report (those with positions large enough to be reported to the exchange) were adding to their net short holdings on the way up and have maintained the position as the market consolidated. This is contrary to the common belief that the recent rally has been fueled primarily by short covering. In fact, with over 300,000 net contracts sold, large speculators are currently holding the largest net short position since 2007. On three occasions since 2007, they have gotten aggressively short to a slightly lesser degree; each of those excessive net short positions lead to a short squeeze followed by a healthy rally spanning two years or more. It is our view that without some sort of historic financial debacle such as the global financial crisis, the outcome will be the unwinding of the short position which puts upward pressure on the broad stock market.
Monthly S&P 500 chart
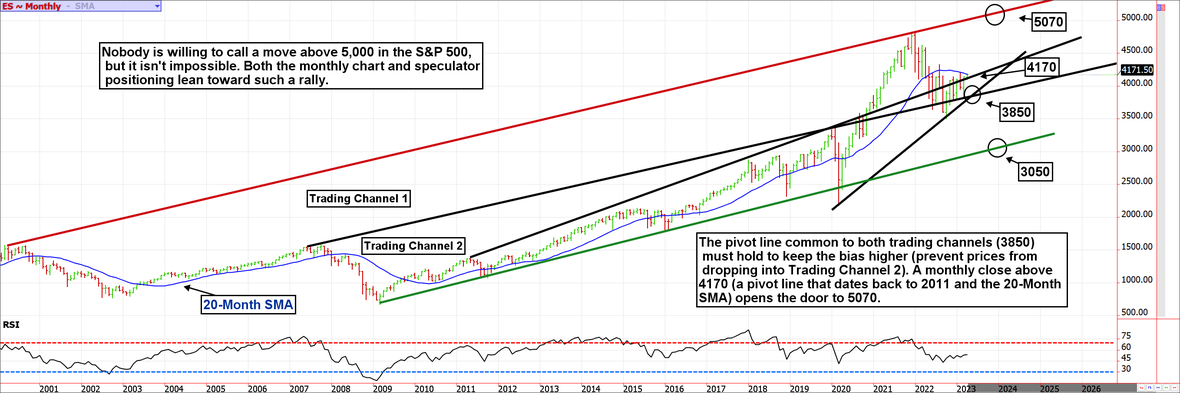
The last twenty years of monthly price bars have created two trading channels that share a common border. The resistance line of Trading Channel 1 can be drawn by connecting the late 1990s high and the late 2021 high. The support line comes from the 2007 pre-Financial Crisis high and connects various highs and lows that have occurred since. This pivot line has been responsible for the 2020 breakout rally and has proven to be highly supportive since. We have yet to see a monthly close below this pivot line in post-Covid trade. For now, that trendline lies at 3850. Coincidently, a sharp uptrend line from the Covid low to the October 2022 low also comes in at 3850. This level will need to continue to hold to avoid a market wipeout toward 3000; in other words, a return to Trading Channel 2. We can’t rule this out, but we believe the most probable outcome, due to market positioning, would be a monthly close above 4170. If this were to happen, it would likely open the FOMO floodgates. 4170 marks the 20-month simple moving average but it also represents a pivot line that dates to 2011. The monthly chart clearly depicts the tendency for a market to continue in its current direction after crossing over the 20-month moving average. Thus, a break above would suggest a longer-term bull could be emerging from the rubble.
The RSI, Relative Strength Index, is hovering near 50 with an upward trajectory. This suggests the path of least resistance is higher overall despite short-term volatility.
While it is difficult to imagine a scenario in which positive fundamentals push the S&P 500 toward 5000, the unwinding of short positions and the reallocation of cash back into stocks can make it happen in spite of questionable fundamentals. If so, this would take several months or even a few years to accomplish, but it isn’t as unlikely as the masses assume it to be.
Common correction/projection ratios are in play
I’ll leave the hard-core Fibonacci analysis to Carolyn Boroden, but I couldn’t help but notice the correction from the 2021 high to the October 2022 low was precisely a 50% retracement. Rallies often correct 50% of their entire move before resuming higher but we won’t be able to confirm a high probability of a new all-time-high until we see prices clear 4300.
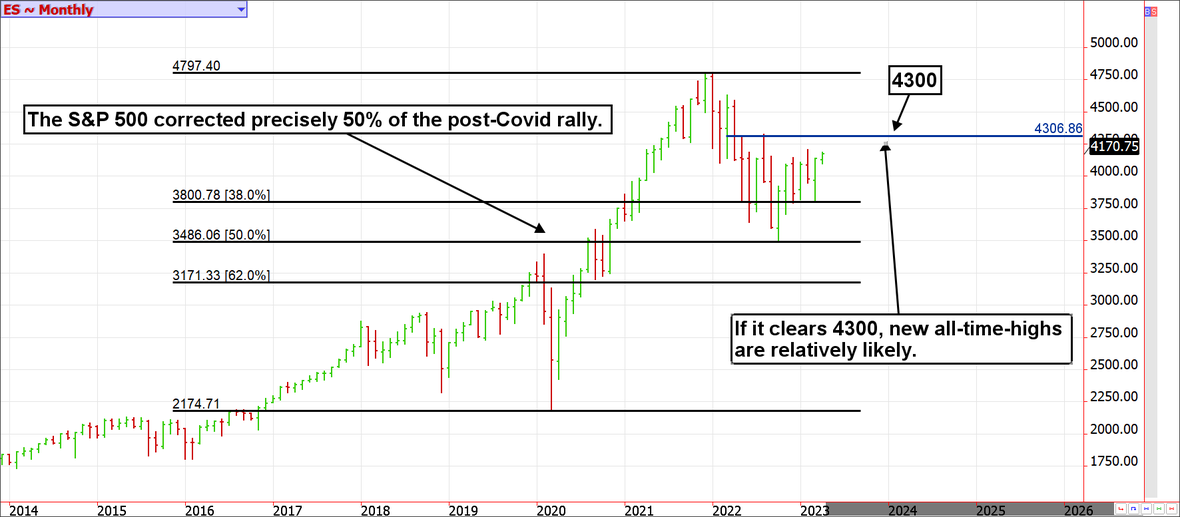
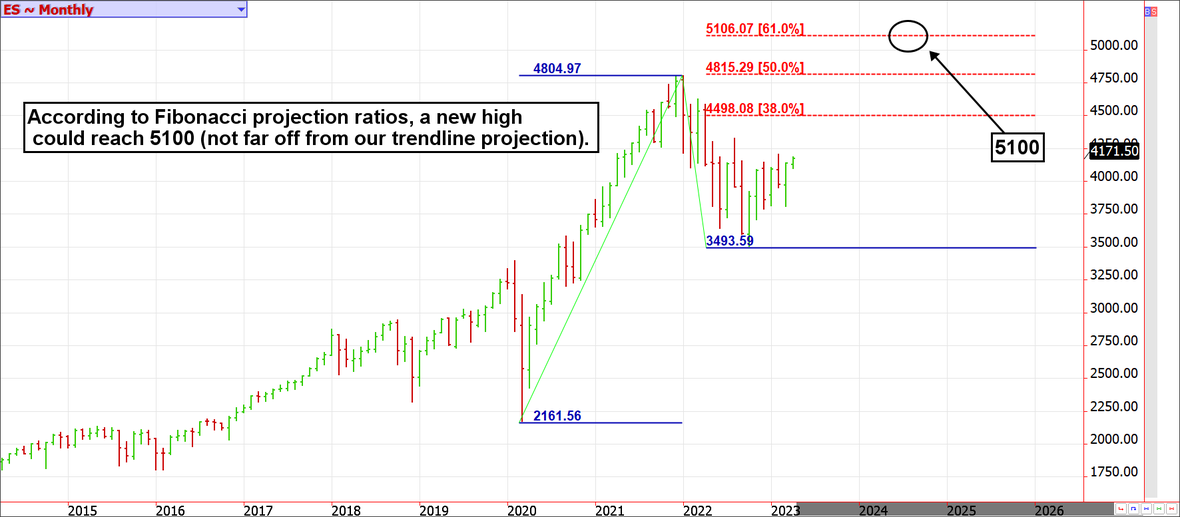
The 4300 pivot price is a little higher than the 4170 pivot price from our trendline analysis, but the idea is similar. If the S&P 500 surpasses 4300, the extension could reach any one of the Fibonacci projection levels of roughly 4500, 4800 or 5100. The 5100 projection is close to our trendline projection of 5070. Thus, we believe there is a real probability of seeing such a move sooner than most believe feasible.
Conclusion
Despite widespread negativity, the odds are in favor of a positive close to the year for the S&P. According to the Stock Trader’s Almanac, all pre-election years since 1949 have an average gain of 16.8%. Even more compelling; pre-election years after a midterm bear market, like we saw in 2022, average 20.3%, and first-term presidents’ pre-election years average 20.1%.
Four months into the year the S&P 500 is only moderately positive, but election cycle history and market positioning (more specifically the need for short covering or portfolio reallocation into stocks) greatly increase the odds of the index surpassing the technical barriers needed to melt higher as the year wears on.
Author

Carley Garner
DeCarley Trading
Carley Garner is an experienced commodity broker with DeCarley Trading, a division of Zaner, in Las Vegas, Nevada. She is also the author of multiple books including, “Higher Probability Commodity Trading” and “A Trader's First Book on Commodities”.