The swing trade level for XYZ I’m watching

Block Inc (XYZ) is trading relatively flat today, but the bigger picture on the chart is what has my attention. After the company reported earnings on February 26th, the stock had a powerful move higher, pushing up more than 24% in a very short period of time. Moves like that always stand out to me because they often leave behind important areas on the chart that can become key technical levels later on.
For those who may not be familiar, Block Inc—formerly known as Square—is a financial technology company focused on digital payments and financial services. The company operates platforms that help businesses process payments while also offering financial tools to consumers. Because of its role in the digital payments ecosystem, the stock tends to attract significant attention from traders whenever earnings results or guidance spark a strong move in the price.
Following that earnings-driven surge, the stock has since pulled back more than 11.5% from its highs. Pullbacks after a strong move are normal and, in many cases, healthy for a chart. When I look at situations like this, I focus on the technicals and the areas where price previously moved quickly, because those zones often become meaningful levels if the stock retraces back toward them.
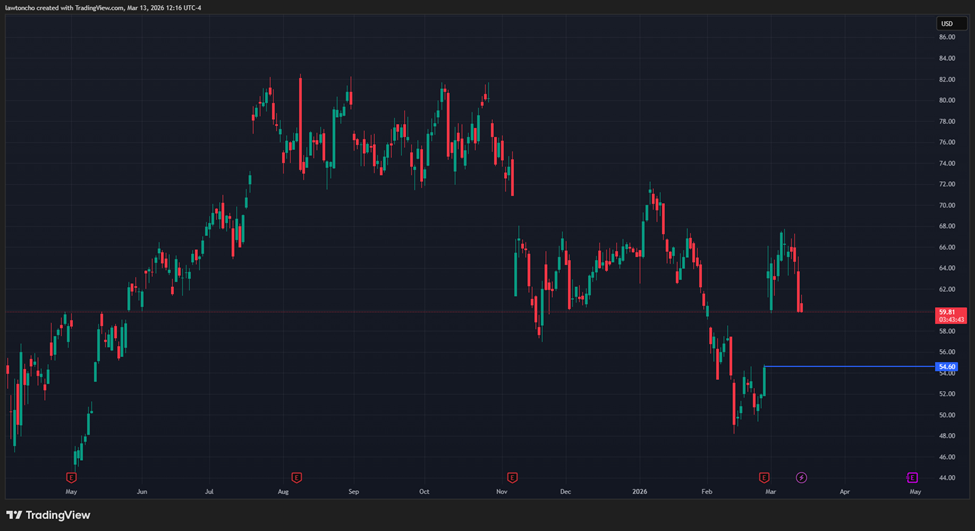
If the stock continues to fall from here, there is a specific level of support that I would consider for a potential swing trade. The level I am watching sits around $54.60, which corresponds with the gap fill created during the earnings move. For the stock to reach that area, it would require a complete reversal of the earnings-driven gain, bringing price back down to where the gap originally began.
In my experience, gap fills can act as strong technical areas where buyers may step in. That does not mean the level is guaranteed to hold, but it is a zone where I begin paying close attention to the price action and the technicals to see whether a swing trade opportunity develops.
As always, regardless of how compelling a level may appear on the chart, risk management remains the most important part of trading. No level is perfect, and protecting capital should always come before chasing a trade.
Author

Lawton Ho
Verified Investing
A marketing expert sharing his journey to mastering the charts.


