The S&P500’s larger correction is underway, but it can still allow for new all-time highs

Before we get into the details, let’s look at a simple line chart. See Figure 1 below. Line charts are based on the closing price, which is the most important price of the day. All technical indicators, moving averages, and even many institutional orders rely on it. Additionally, it helps reduce intra-day noise.
As of last Friday’s close, the index was only down 3.5% from its all-time (closing) high of $6978 on January 27. It has been a remarkably resilient stock market, all things considered, and this really makes one wonder what all the fuss is about. For example, the VIX spiked to nearly 30, its highest level since the February-April ~20% “Trump Tariffs Tantrum” correction last year. Even the November correction (green Wave-4 in Figure 1 below) was deeper at 5.2% on a daily closing basis, but the VIX only spiked to 28.
Hence, it appears current sentiment is a bit too bearish for the extent of the current pullback. So what’s going on? Allow us to explain below.
Figure 1. Short-term Elliott Wave count for the SPX
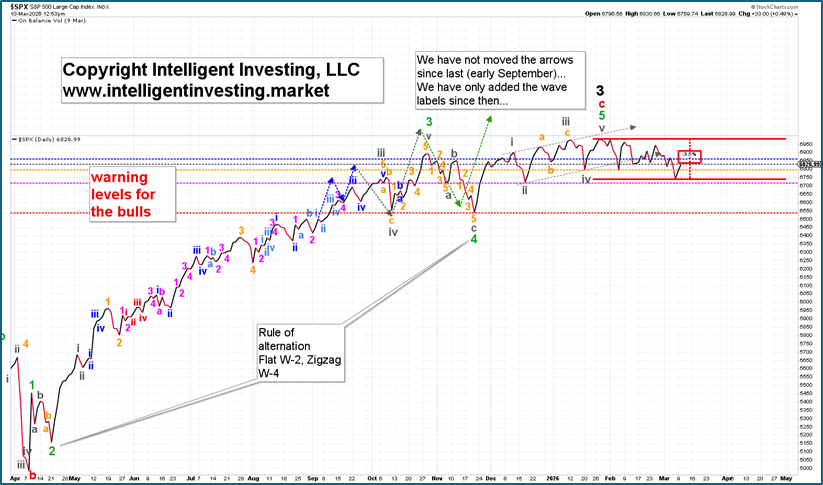
In our previous update, about the S&P500, we concluded that “if the Bulls can at least hold 6780, our third warning level, which equates to a 60% chance that the uptrend is over on a daily close below it, we can allow for that last [5th wave] to ideally 7120-7190 to take hold into the April turn date window. If they can’t, we must watch for the 6575 level.”
Fast forward to today: the index breached the 6780 level not until Wednesday, March 3, and continued to do so on March 5, 6, and 9, with yesterday’s ultimate low at 6636. Thus, our insight from three weeks ago that “below 6780 can target 6575” was off by only 0.9%.
We are not afraid to admit that forecasting yesterday’s low was challenging each day and often frustrating, given the stock market's overlapping downward pattern as the decline from the January 28 ATH at 7002 evolved into a triple zigzag: the green a-b-c pattern transformed into an abc-b-a-abc-abc pattern. See Figure 2 below. Such a complex correction cannot be foreseen in advance, as after the initial abc move, a correction can be considered finished. Additionally, the index stayed within a range, remaining above 6780 until last Monday, which gave no clear sign of whether it would rally more quickly to 7120+ or correct further first.
Figure 2: Short-term Elliott Wave count for the SPX, with anticipated path forward
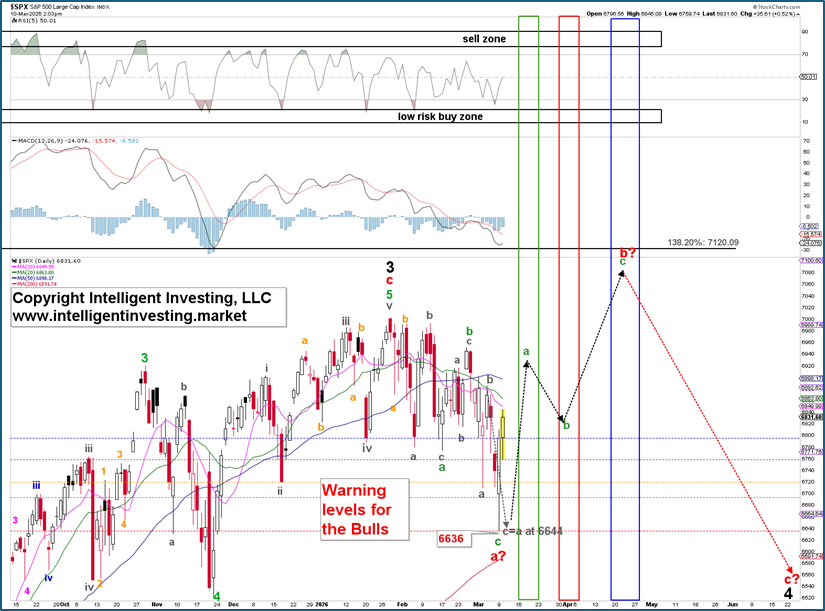
Thus, at yesterday’s low, the index reached the ideal (gray) W-c = W-a target of 6644, bottoming at 6636. Except for the rally in early February, which lasted just over three days, the index has now experienced its largest rally in only two days. Therefore, the chances are increasing that the three-wave (green a, b, c) red W-a of the black W-4 has bottomed.
4th waves, like any other correction, consist of at least three waves: red W-a, b, and c. Although we cannot predict exactly how it will unfold—since no one has a crystal ball—we know that 4th waves are often flat (abc-abc-1,2,3,4,5), triangular (abc-abc-abc), or a mix of both. Since the historic 2009 low, the current bull market’s larger 4th wave corrections have been flat corrections (2011, 2015/2016, 2018-2020). So, we can expect it to happen again.
In an irregular flat, the B-wave reaches a new ATH, as seen in 2011 and 2019. The future projection, based on mid-term election-year highs and lows and the Armstrong Pi-cycle turn dates (green, red, and blue timing boxes), is shown in Figure 2. It supports the development of such an irregular flat, contingent on price holding above 6636, the Bulls' 5th and final (red) warning level. After reaching the high, likely around late April, we should expect weakness until late September: the red C-wave.
Author

Dr. Arnout Ter Schure
Intelligent Investing, LLC
After having worked for over ten years within the field of energy and the environment, Dr.


