The Dow Jones Industrial Average lets refiners price the war
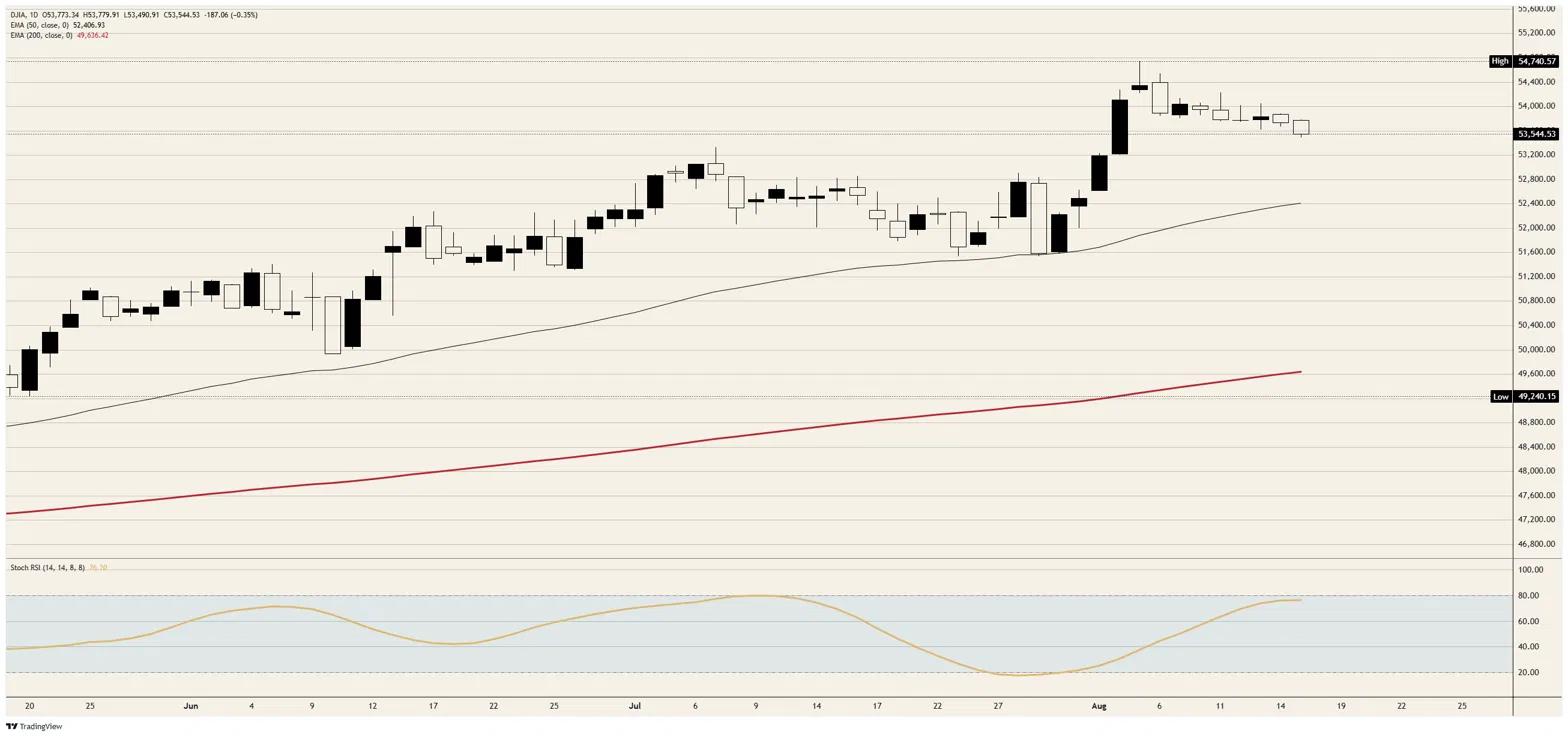
- DJIA trades near 53,550, roughly 1,200 points beneath the August 5 record.
- The 60-day US-Iran framework expires with three vessels crossing Hormuz on Sunday.
- Refiners at record highs on diesel margins near $100 a barrel, all outside the index.

The Dow Jones Industrial Average (DJIA) trades near 53,550 on Monday, down close to 200 points and roughly 1,200 beneath the record printed on August 5, on the day the 60-day negotiating window that was meant to end the war over the Strait of Hormuz lapses with nothing agreed to replace it. For a second consecutive session, the highest print of the day is the opening print, an index sold from the first minutes rather than one drifting off a mid-morning high.
The deadline arrives with nothing on the other side of it
The memorandum signed at Versailles in June ran 60 days and expires on Monday, with no extension announced and no direct talks under way. A senior Iranian official told Reuters the country may move from a defensive policy to an offensive one should diplomacy fail, escalating both in the Strait and across the wider region, while the Revolutionary Guard's political bureau spent the weekend describing preparations for a US ground operation.
Tehran's foreign ministry argues in reply that the two-month window was never written into the text and that the date carries no particular significance, which is a strange thing to insist on while the physical evidence says otherwise. Three vessels crossed the Strait on Sunday against a five-day average of 12 and roughly 130 a day before the war, and Trump has told Oman, the only live channel left, that getting in the way would be answered with bombing. Crude Oil firmed on the headlines, with West Texas Intermediate (WTI) near the $83.00 handle and Brent above the $88.00 handle.
The war trade is fully priced, just not here
Three large American refiners trade at or near record levels, Valero (VLO) at an all-time high, Marathon Petroleum (MPC) at its best since its 2011 separation and Phillips 66 (PSX) at a record since listing. Valero and Marathon Petroleum have more than doubled this year and Phillips 66 is up roughly 85%, on diesel margins running near $100 a barrel as Ukrainian strikes take Russian refining offline and Gulf capacity stays blocked in behind the chokepoint.
Not one of the three sits in this index. The only energy name among the thirty is Chevron (CVX), an integrated major whose refining arm is a segment inside a business that also owns the barrels going in. The cleanest equity expression of a five-month supply war is being paid out in full on the American tape, and the Dow Jones Industrial Average is not a shareholder in it.
A refining margin near $100 a barrel is also more than a sector curiosity, because diesel is the price of freight, farm equipment and every good that moves by truck. A margin at that level is an inflation input with a delivery lag rather than an energy windfall, and the equity market has spent the last fortnight buying the earnings while pricing away the consequence.
Prices paid up, prices received down
The August Empire State manufacturing survey printed 20.6 against an 11 consensus and 15.6 in July, the strongest reading in more than four years, with unfilled orders jumping ten points to 15.5. New orders and shipments softened from July without leaving expansion and the employment measure eased to 9.3, so the headline is not a hiring story.
The internals carry the more useful signal, since prices paid rose while prices received fell, which is a manufacturer absorbing an input cost it cannot yet pass on. Passthrough deferred is not passthrough avoided. Against a soft Consumer Price Index (CPI) print and a 0.6% retail sales contraction last week, futures took September hike odds from a coin flip on August 10 to roughly a third by Friday, on the view that demand is doing the Committee's tightening for it.
The week answers back
The Federal Open Market Committee (FOMC) publishes minutes from the July 29 meeting on Wednesday at 18:00 GMT, an account of a 9-3 hold argued before the soft inflation prints, before the retail sales miss and before this morning's manufacturing beat, so the record of the debate lands after the data that moved it. Friday's preliminary August Purchasing Managers Index (PMI) readings carry the same red band, manufacturing seen at 53.8 from 53.9 and services at 54 from 54.6.
Tuesday stacks the housing file, with building permits at 1.37 million against 1.374 million and housing starts at 1.35 million from 1.427 million at 12:30 GMT, industrial production 0.3% from 0.1% at 13:15 and pending home sales 0.2% from -5.4% at 14:00. Thursday brings initial claims at 212K against 209K and a Philadelphia Fed survey seen at 25 from 41.4. Home Depot (HD) reports Tuesday and Walmart (WMT) Thursday, giving the consumer who missed last week a second hearing from inside the index.
Dow Jones Industrial Average technical levels
Resistance: The 53,800 area caps, having flipped from floor to ceiling on last session's break, with 53,900 and the early-August ledge near 54,100 above it and the record just short of 54,750 beyond.
Support: The 53,500 area has already been tested this session and is the line that decides the week. Beneath it sit the 53,200 area and then 53,000, with the 50-day Exponential Moving Average (EMA) near 52,400 the deeper defence.
Bias: Bearish. Two consecutive sessions whose high is the opening print, on a daily Stochastic Relative Strength Index (Stoch RSI) that has climbed into its upper band without price making a new high, describe an index distributing rather than basing. Invalidation on a daily close back above 53,800.
Dow Jones daily chart
Dow Jones FAQs
The Dow Jones Industrial Average, one of the oldest stock market indices in the world, is compiled of the 30 most traded stocks in the US. The index is price-weighted rather than weighted by capitalization. It is calculated by summing the prices of the constituent stocks and dividing them by a factor, currently 0.152. The index was founded by Charles Dow, who also founded the Wall Street Journal. In later years it has been criticized for not being broadly representative enough because it only tracks 30 conglomerates, unlike broader indices such as the S&P 500.
Many different factors drive the Dow Jones Industrial Average (DJIA). The aggregate performance of the component companies revealed in quarterly company earnings reports is the main one. US and global macroeconomic data also contributes as it impacts on investor sentiment. The level of interest rates, set by the Federal Reserve (Fed), also influences the DJIA as it affects the cost of credit, on which many corporations are heavily reliant. Therefore, inflation can be a major driver as well as other metrics which impact the Fed decisions.
Dow Theory is a method for identifying the primary trend of the stock market developed by Charles Dow. A key step is to compare the direction of the Dow Jones Industrial Average (DJIA) and the Dow Jones Transportation Average (DJTA) and only follow trends where both are moving in the same direction. Volume is a confirmatory criteria. The theory uses elements of peak and trough analysis. Dow’s theory posits three trend phases: accumulation, when smart money starts buying or selling; public participation, when the wider public joins in; and distribution, when the smart money exits.
There are a number of ways to trade the DJIA. One is to use ETFs which allow investors to trade the DJIA as a single security, rather than having to buy shares in all 30 constituent companies. A leading example is the SPDR Dow Jones Industrial Average ETF (DIA). DJIA futures contracts enable traders to speculate on the future value of the index and Options provide the right, but not the obligation, to buy or sell the index at a predetermined price in the future. Mutual funds enable investors to buy a share of a diversified portfolio of DJIA stocks thus providing exposure to the overall index.
Author

Joshua Gibson
FXStreet
Joshua joins the FXStreet team as an Economics and Finance double major from Vancouver Island University with twelve years' experience as an independent trader focusing on technical analysis.