Tesla trade idea: How to play the long term trend decelerating higher

Introduction
VolatilityMarkets suggests top quant trade ideas to take advantage of trending markets.
Market summary
TSLA last price was $ 200.86 . In the short term Tesla has been negatively accelerating higher. In the long term Tesla has been decelerating higher. Over the past 22 days, the TSLA price increased 12 days and decreased 10 days. For every up day, there were 0.83 down days. The average return on days where the price increased is 5.7899% The average return on days where the price decreased is -2.7139% Over the past 22 Days, the price has increased by 47.83% percent. Over the past 22 days, the average return per day has been 2.1741% percent. With the long term trend being the stronger of the two, we propose a long trade idea with an overnight time horizon.
The trade idea
Buy $ 47,495 USD of Tesla,
Take profit
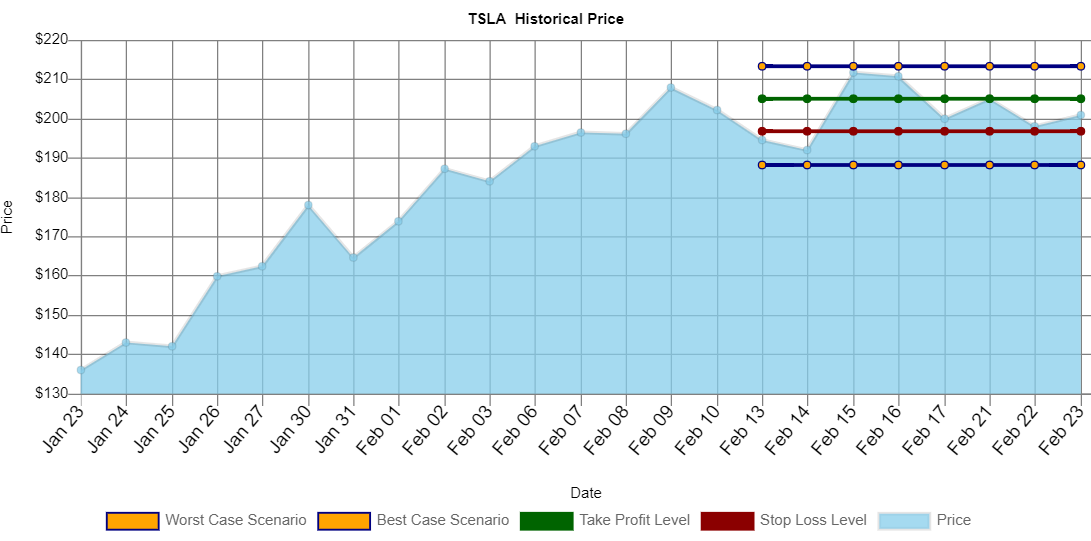
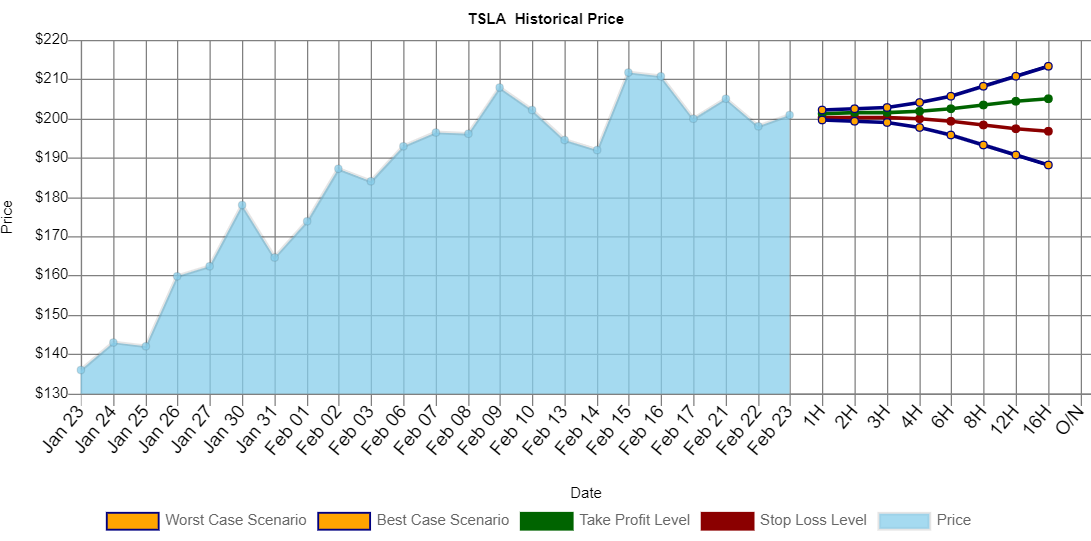
At $ 205.0878 level with 50.01% odds for a $ 999 USD gain,
Stop out
At $ 196.6309 with 50.0% odds for a $ 1,000 USD loss through O/N time horizon.
Intraday predictions
TSLA trend analysis
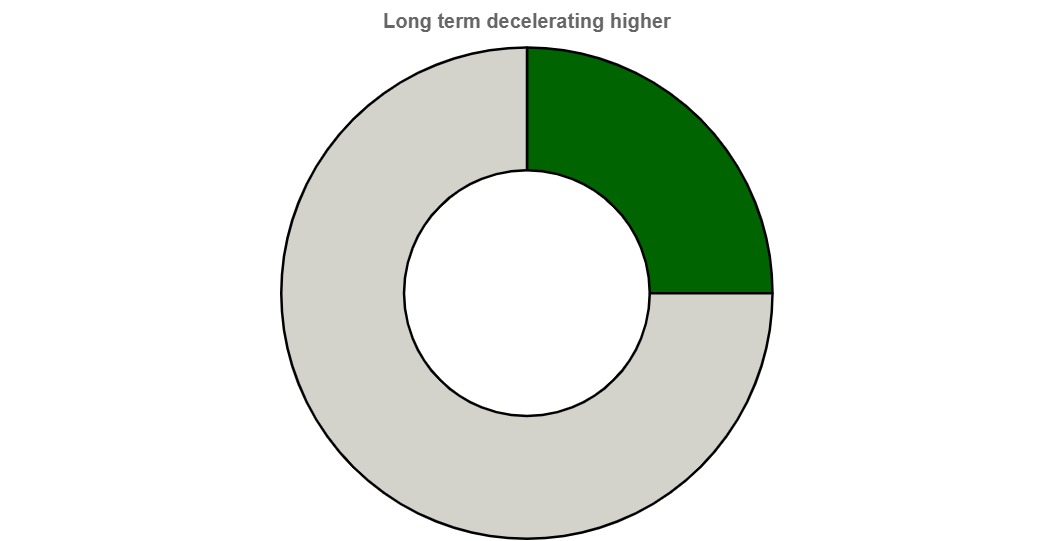
TSLA last price was $ 200.86 . The long term trend decelerating higher is stronger than the short term trend negatively accelerating higher. This trade goes long when the price was moving higher but decelerating over the past 22 days.
TSLA value analysis
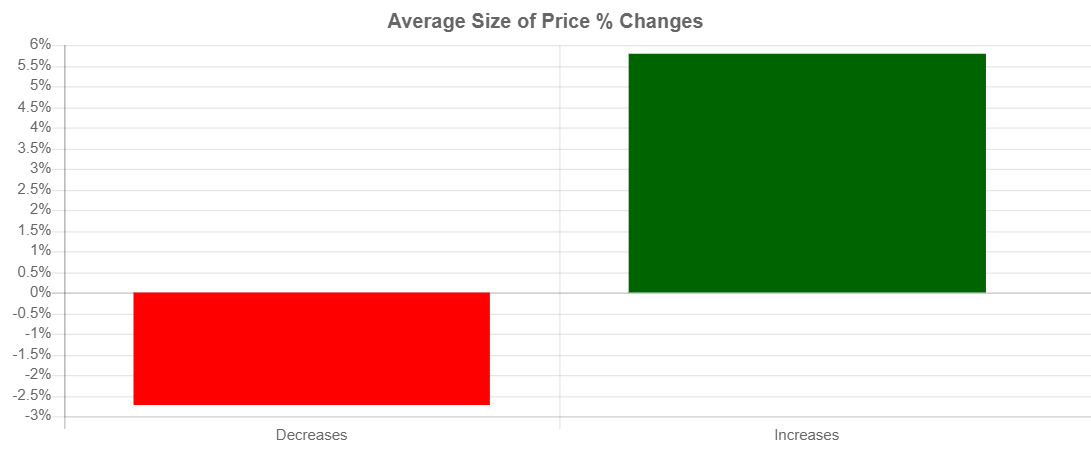
Over the past 22 days, the TSLA price increased 12 days and decreased 10 days. For every up day, there were 0.83 down days. The average return on days where the price increased is 5.7899% The average return on days where the price decreased is -2.7139% Over the past 22 Days, the price has increased by 47.83% percent. Over the past 22 days, the average return per day has been 2.1741% percent.
TSLA Worst/Best case scenario analysis
Within 1 week, our worst case scenario where we are 95% certain that this level won't trade for TSLA, is $ 188.25, and the best case scenario overnight is $ 213.47. levels outside of this range are unlikely, but still possible, to trade. We are 50% confident that $ 196.6309 could trade and that $ 205.0878 could trade. These levels are within statistical probability.
Expected range
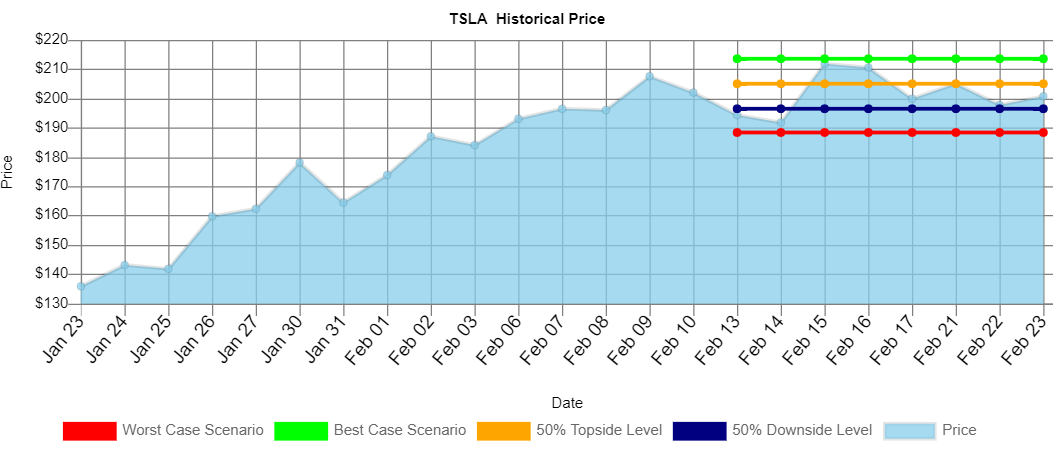
Within 1 week, our worst case scenario where we are 95% certain that this level won't trade for TSLA, is $ 188.25, and the best case scenario overnight is $ 213.47. levels outside of this range are unlikely, but still possible, to trade.
We are 50% confident that $ 196.6309 could trade and that $ 205.0878 could trade. These levels are within statistical probability.
Probability vs payout chart
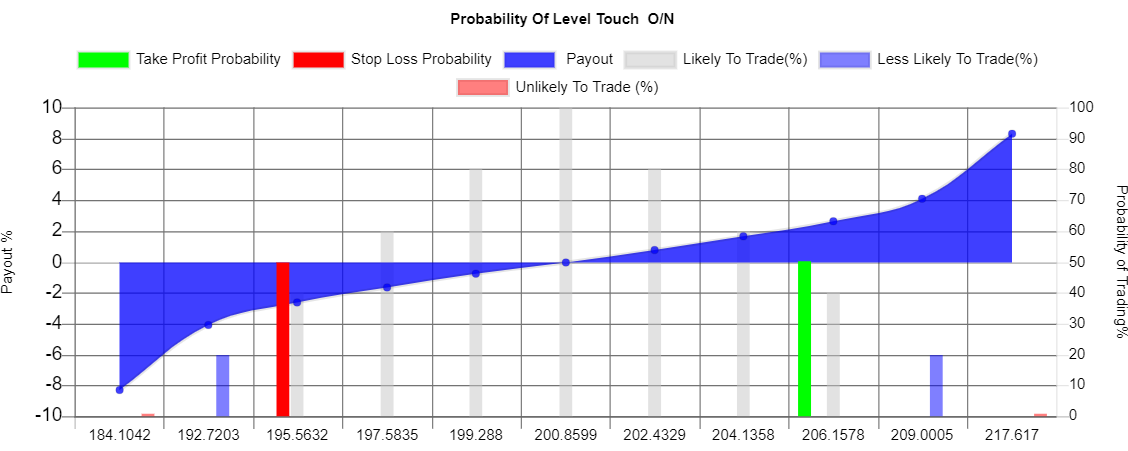
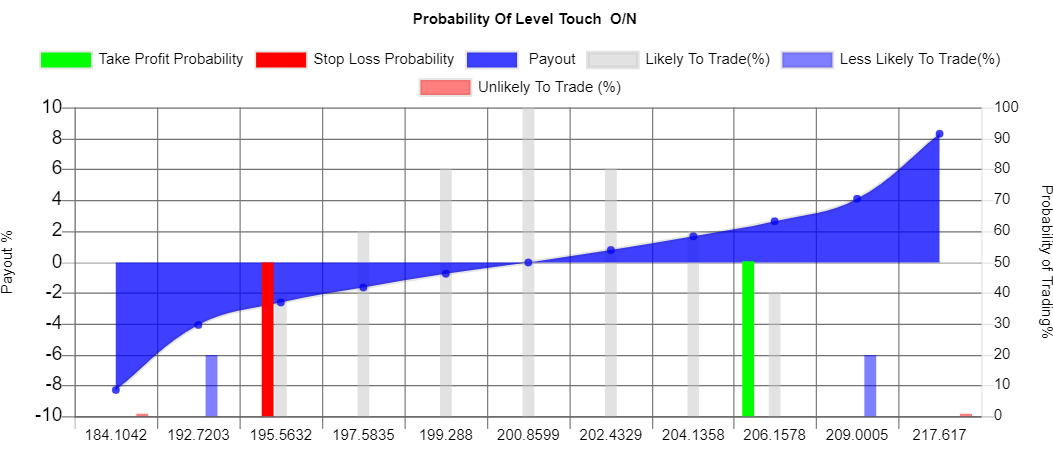
This graph contrasts the percentage payout of holding a position vs the probability that the payout occurs. The red and green columns represent the probability of stopping out and taking profit and their associated payouts.
Key takeaways
-
Price today $ 200.86.
-
Over the past 22 days, the TSLA price increased 12 days and decreased 10 Days.
-
For every up day, there were 0.83 down days.
-
The average return on days where the price increased is 5.7899%.
-
The average return on days where the price decreased is -2.7139%.
-
Over the past 22 Days, the price has increased by 47.83% percent.
-
Over the past 22 days, the average return per day has been 2.1741% percent.
-
Over the past 22 days, The price has on average been decelerating: $ -0.20 per day higher.
-
Over the last session, the price increased by $ 2.93.
-
Over the last session, the price increased by 1.4587 %.
-
Over the last session, the price decelerated by $ -4.13.
Author

Barry Weinstein
Volatility Markets Newswire
Barry Weinstein was a forex derivatives trader at BlueCrest Capital which was one of the largest hedge funds in Europe and then joined Credit Suisse where he assisted in running one of the largest FX Options portfolios in Europe.

















