|
Stock markets soar as predicted [Video]
![Stock markets soar as predicted [Video]](https://editorial.fxsstatic.com/images/i/Equity-Index_S&P500-1.jpg)
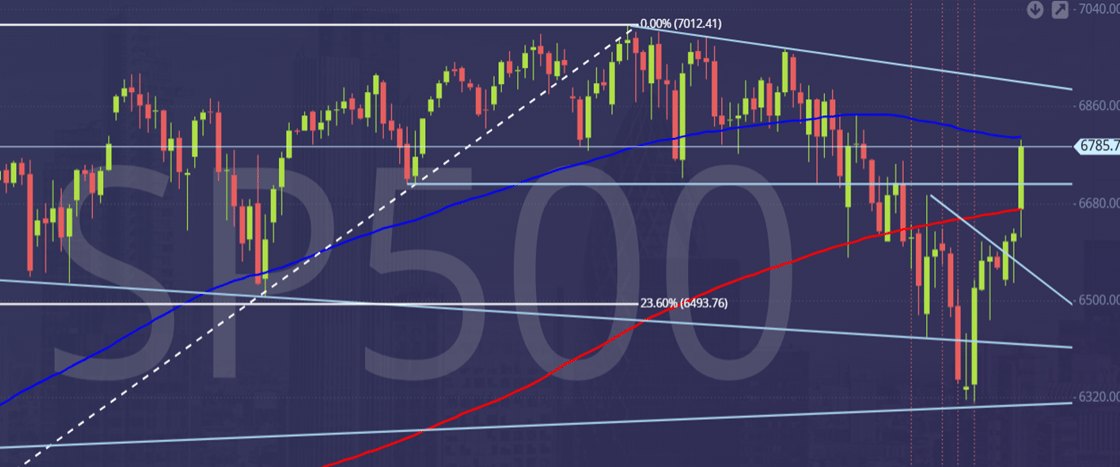
Emini S&P futures
- Emini S&P June futures had a potential bullish, inverse head & shoulders pattern, with neck line at 6620.
- So bulls had to hold prices above here for the bullish pattern to play out.
- Longs needed stops below 6600 and this was unlucky, as prices did drop to 6573 before we shot higher to beat 6650/6660.
- The break above here was our buy signal initially targeting 6690/6700 & 6740/6750.
- We have hit the 100 day moving average at 6825 & reached 6831.
- So there is minor resistance at 6825/6835 although after the news I would not feel confident in a short position.
- A break above 6845 should be a buy signal targeting 6885/6890.
- I guess the downside is likely to be limited now with some support at 6775/6765 & longs need stops below 6750.
- A break lower risks a slide to support at 6710/6700.
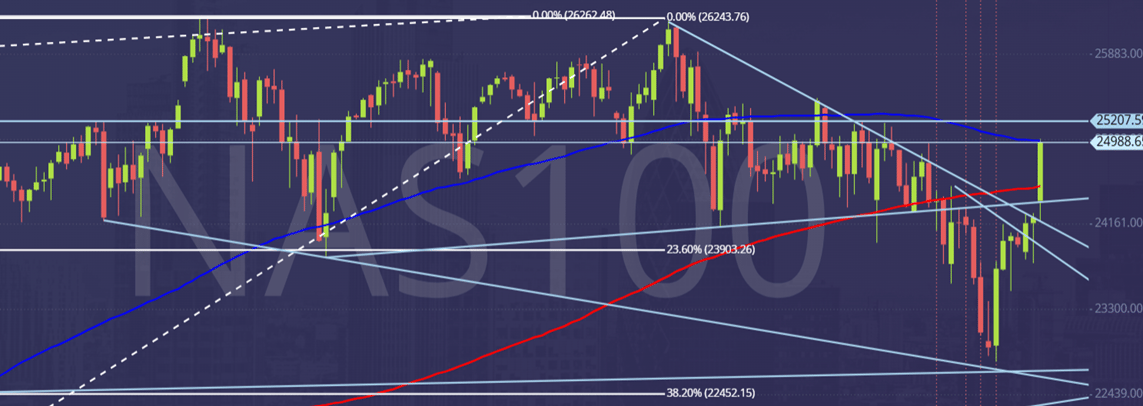
Nasdaq futures
- Emini Nasdaq June futures bullish, inverse head & shoulders pattern, with neck line at 24170/24150 was tricky yesterday as we dipped to 23942.
- With the over night news we shot higher to 24310/350 & through resistance at 25550/25600 for a buy signal targeting 24940/990 then 25100/25150.
- All targets hit as we now look for 25250/300. We may pause here but shorts look too risky.
- A break above 25350 can target 25600/630.
- I guess the downside is likely to be limited now with some support at 25030/25000.
- However a break below 24900 risks a slide to 24800/750 & longs need stops below 24600.
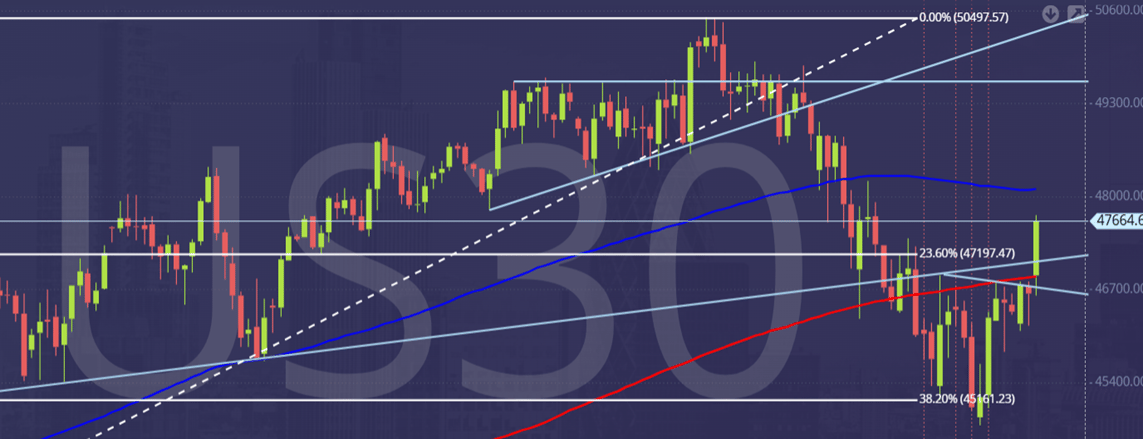
Emini Dow Jones futures
- Emini Dow Jones June had the same head & shoulders pattern with neck line at 47000/47100.
- The break above here was a buy signal targeting 47250, 47500 & some minor resistance at 47900/48000
- An over night high exactly here as I write....& as I said yesterday: although we should struggle here, I think shorts would be risky.
- A break above 48100 should be a buy signal targeting 48400/500.
- A break above 48600 is a buy signal targeting 48850/48900.
- Support at 47300/47200 & longs need stops below 47000.
Author

Jason Sen
DayTradeIdeas.co.uk
Jason Sen began his career in the options pits on the trading floor of LIFFE in 1987 at the age of 19, making markets on his own account. In 2001 when the trading floor closed he successfully made the transition to day trading on computer screens.
More from Jason Sen


