|

SPX Elliott Wave chart: Larger decline resumes [Video]

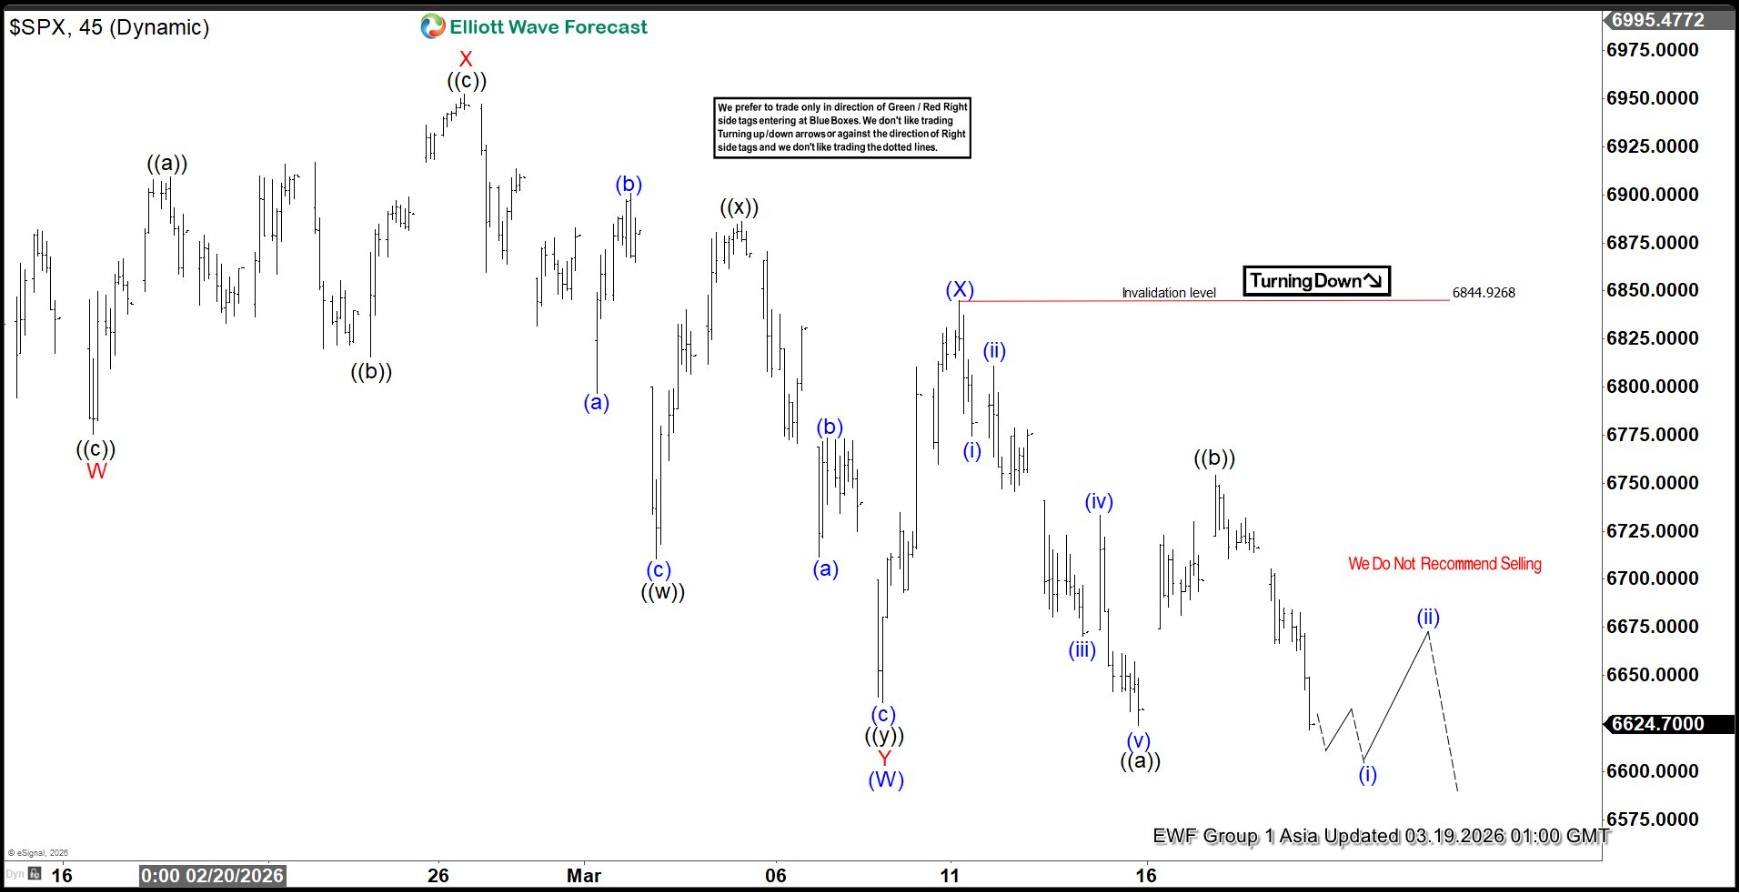
The S&P 500 (SPX) continues to correct the cycle that began from the April 7, 2025 low. The internal subdivision of this correction is unfolding as a double three Elliott Wave structure, which reflects a complex corrective pattern rather than a simple decline. From the January 28, 2026 peak, wave (W) concluded at 6636.04, as illustrated in the 45‑minute chart. Within wave (W), the internal subdivision itself developed as another double three of lesser degree. In this sequence, wave W ended at 6775.5, wave X at 6952.51, and wave Y at 6636.04. This completed wave (W) at the higher degree.

Following this, wave (X) produced a corrective rally that terminated at 6884.9. The index has since resumed its downward trajectory in wave (Y). From the peak of wave (X), wave ((a)) ended at 6623.92, while wave ((b)) rallied to 6754.3. The near‑term outlook suggests that as long as the pivot at 6844.92 remains intact, rallies are expected to fail in either three or seven swings, leading to further downside pressure. This aligns with the broader corrective structure and reinforces the bearish bias.

The potential target for the decline is measured using the 100% to 161.8% Fibonacci extension of wave (W). This extension projects a zone between 6247 and 6475. Within this area, buyers may emerge, offering the possibility of renewed upside momentum. Thus, while the short‑term path favors weakness, the medium‑term view anticipates that the correction could eventually provide a base for another rally once the projected support zone is tested.

S&P 500 (SPX) 45-minute Elliott Wave chart

SPX Elliott Wave [Video]

Youtube preview

Author

Elliott Wave Forecast Team

Elliott Wave Forecast Team

ElliottWave-Forecast.com

More from Elliott Wave Forecast Team
Share:

Editor's Picks

GBP/USD bounces off lows, back above 1.3200

After bottoming out near 1.3160, GBP/USD manages to regain a bit of shine and reclaim the 1.3200 mark and beyond at the end of the week. Stronger-than-expected UK Retail Sales data seem to be helping the British Pound limit its losses, while the chaotic UK political environment keeps the bulls at bay for now.

EUR/USD looks consolidative around 1.1460

EUR/USD stages a modest rebound after slipping to a three-month low below 1.1420 at the end of the week. That said, the pair now looks to consolidate humble gains just above 1.1460 despite growing uncertainty surrounding the next round of US-Iran negotiations, which keeps the US Dollar’s downside contained.

Gold slips back to six-day lows, targets $4,100

Gold retreats for the third consecutive day on Friday, eroding gains seen in the first half of the week and approaching the key $4,100 mark per troy ounce. Indeed, the precious metal continues to face headwinds from the Fed's hawkish stance and renewed uncertainty surrounding the next round of US-Iran negotiations.

Solana extends correction despite ETF inflows, RWA adoption

Solana (SOL) price edges below $70 extending its losses for the fourth straight day this week. The institutional demand for Solana is building, with steady inflows so far this week and Morgan Stanley’s amended S-1 filing for a Solana-focused Exchange-Traded Fund.

The Iran war didn't break the US economy, but what happens next?

Nearly four months after the start of the Iran war, the US economy remains remarkably resilient. While the conflict initially triggered a severe disruption to global energy markets and a sharp rise in Oil prices, recent diplomatic progress between Washington and Tehran has eased concerns about a prolonged supply shock.

Regime change: Inside Kevin Warsh's first move to make the Fed unreadable on purpose

The rate did not move. That was the least interesting thing about Kevin Warsh's first meeting in charge of the Fed. The FOMC held its benchmark at 3.50%-3.75% for the fourth straight meeting, exactly as priced, and then the new chair used his first press conference to dismantle the machinery the market has leaned on for a decade.