S&P 500: Seasonality and market breadth suggest pullback near completion as Elliott Wave pattern targets 8,125

In our previous update, we used the Elliott Wave Principle (EWP) to track a potential bullish 3rd-wave setup in the S&P 500 (SPX) when it was trading around 7650. We expected “a short-term pullback, … ideally targeting 7610 +/- 30. … From there, we can expect a larger rally to 8700+.” The index bottomed at 7616 the next day and rallied to 7844 by October 6, but then fell too far, breaking below several key warning levels for this 3rd-wave path to continue. We correctly anticipated the low and the subsequent rally, but after October 6 the index did something else. As such, we must update our EWP count to a larger ending-diagonal (ED) pattern. See Figure 1 below.
Figure 1: S&P 500 daily chart with our bullish Elliott wave count and several technical indicators.
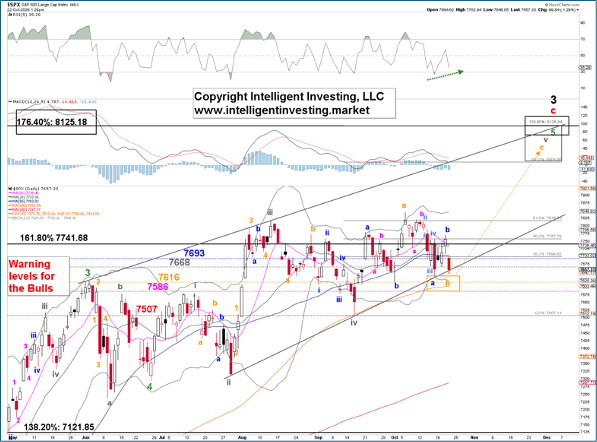
In an ED, a terminal pattern, the 1st, 3rd, and 5th waves can comprise five or three waves. In this case, we’re tracking a three-wave final (gray) W-v to ideally 8000-8125, subdividing into orange W-a, -b, and -c. W-b is now underway, ideally to 7590-7635, before W-c can take hold. Note that the upper end coincides exactly with the 176.40% extension of the March 2020->January 2022 rally, measured from the October 2022 low; major waves 1 and 2, respectively. As with the last update, the index must remain above the September 16 low of 7507 for this pattern to unfold. If it can’t, we must turn course and assign a bearish wave count.
Seasonality supports the bullish case. The index tends to decline from October 21 through October 27, followed by an almost yearlong rally*. See Figure 2 below. Despite an over 1% down day yesterday, the cumulative advancing/declining (A/D) line increased, meaning more stocks advanced than declined, as most selling was confined to the technology sector and was not broad-based.
Figure 2: S&P500 seasonality chart and cumulative A/D line.
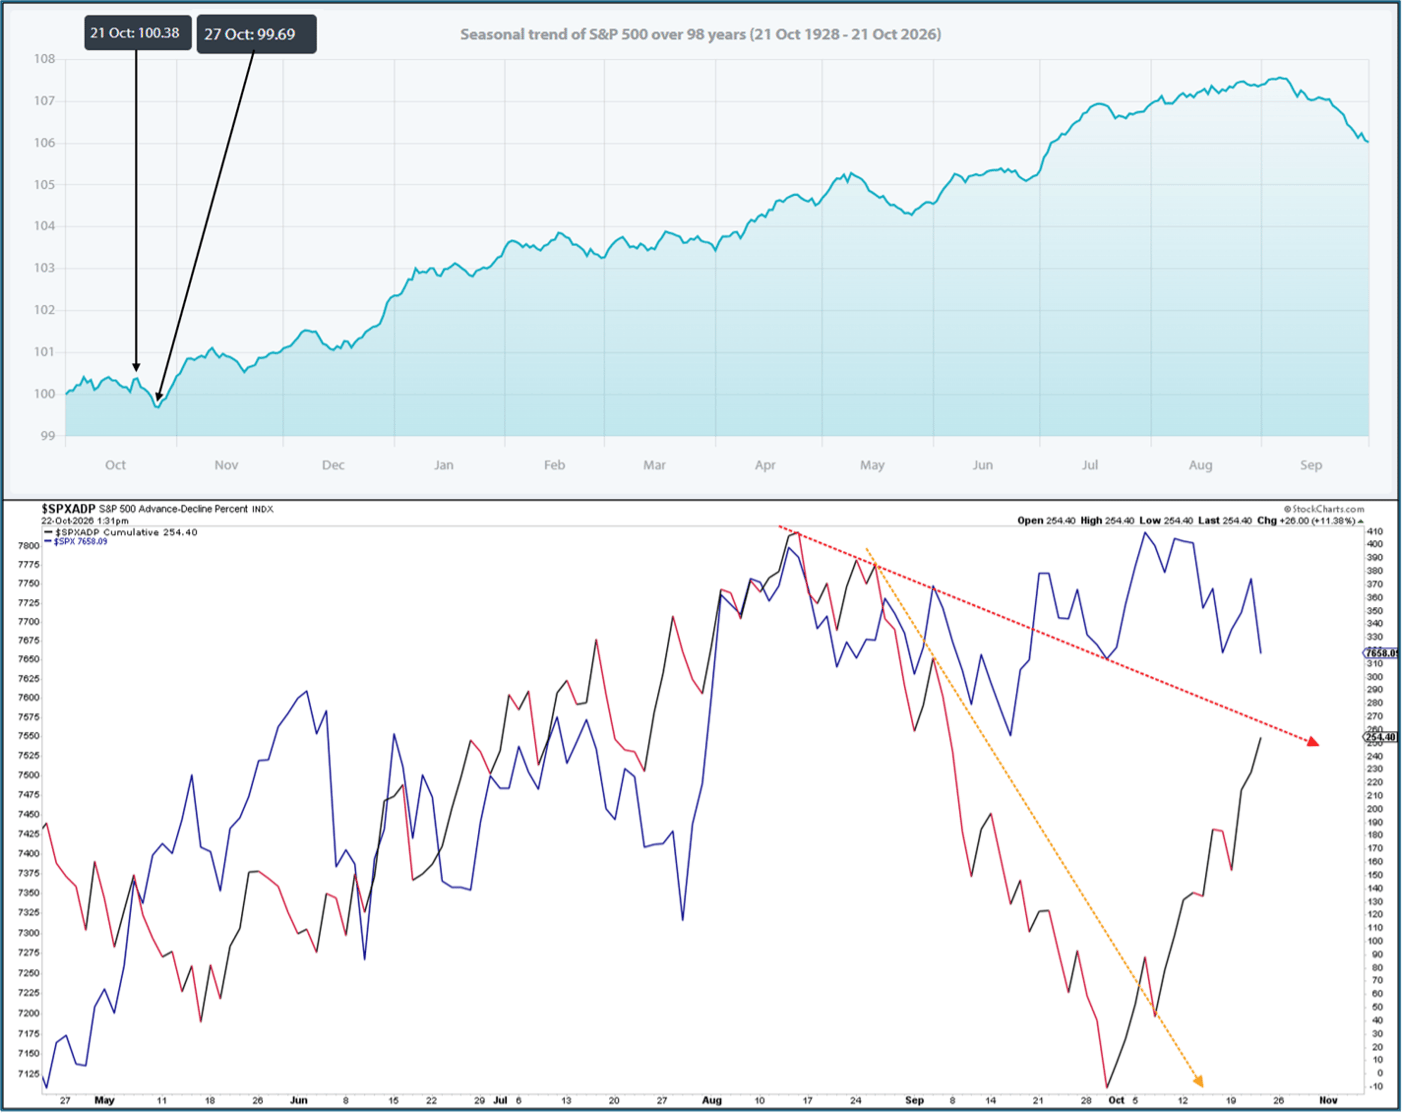
Lastly, the A/D line is about to test its major (red, dotted) downtrend line in place since its August high. A break above that line will strongly signal that the A/D’s downtrend, and, with it, the market’s downtrend, has ended.
*The seasonal pattern has been reasonably on track for October: A low was due on 09/30 (on a closing basis). The index bottomed on 09/30 (technically 10/01). A high was due on 10/06. The SPX topped out on 10/06 (both on a closing basis and as the actual high). Then, on average, a low was due around 10/09; the index bottomed on 10/08. Seasonally, a high comes in around 10/13, followed by a low around 10/19, then another high and low around 10/21 and 10/27, respectively. We got the high on 10/12 (but not on a closing basis), and the decline ended on 10/16, with a top yesterday on 10/21.
Author

Dr. Arnout Ter Schure
Intelligent Investing, LLC
After having worked for over ten years within the field of energy and the environment, Dr.