|

S&P 500 is testing the top of a four-year logarithmic channel

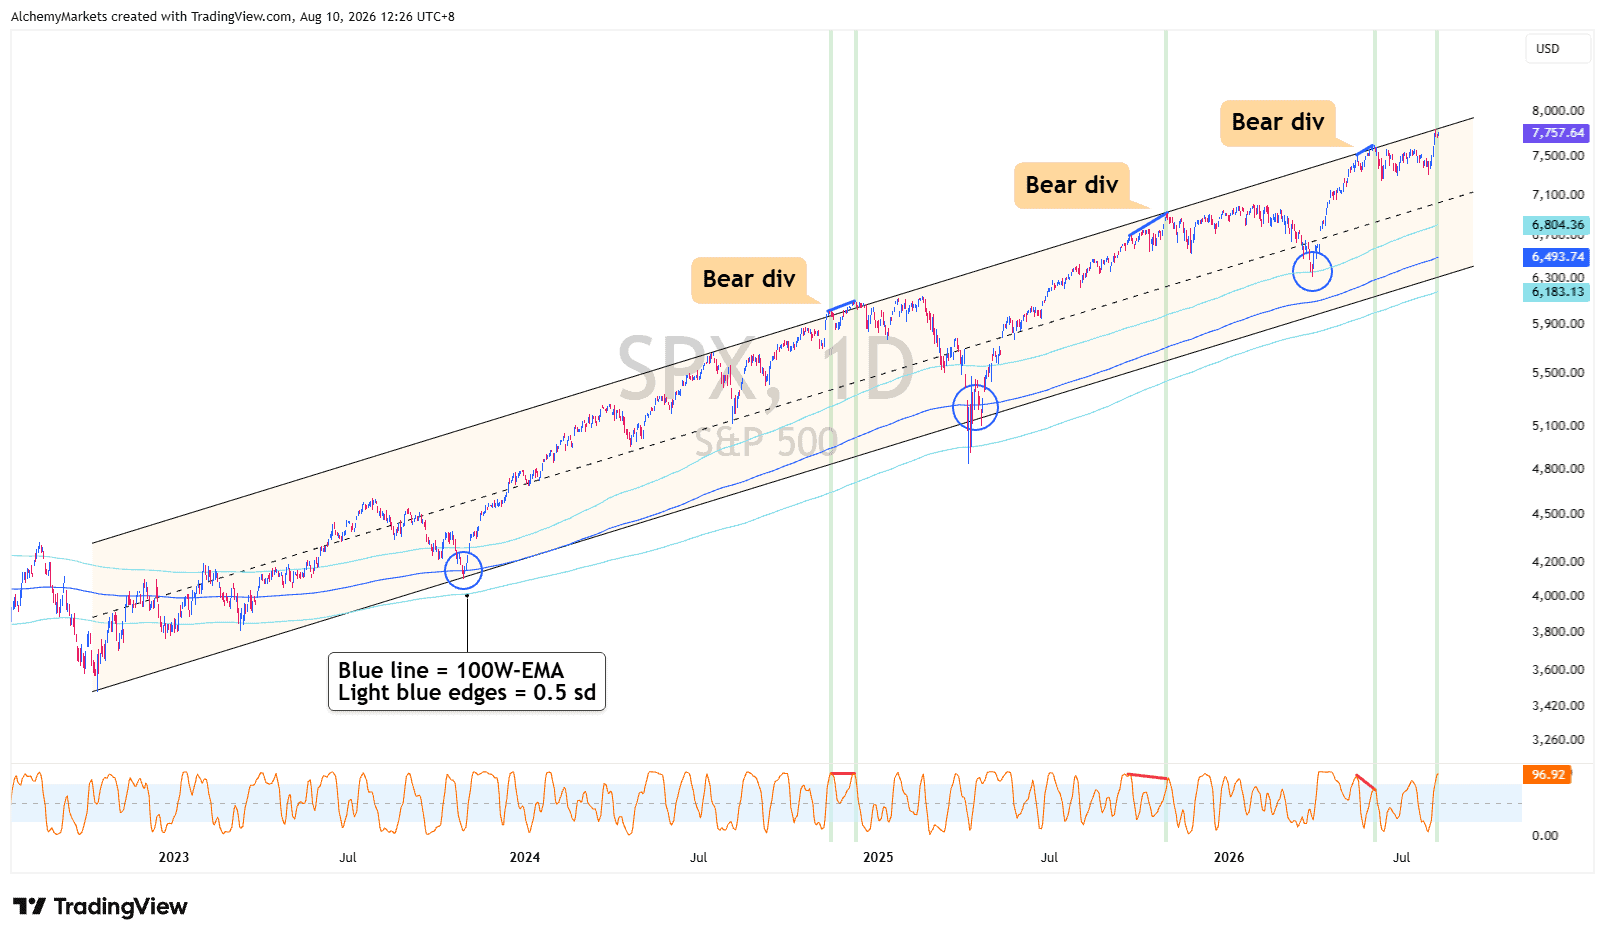
The S&P 500 is now testing the top of a logarithmic rising channel stretching back to 2022, while Stochastic RSI has pushed into overbought territory.

Previous tests of this top has resulted in a bearish divergence on the daily timeframe, where price continued to push higher with weakening momentum. This was eventually followed by a decline.
SPX

So if price pushes higher and forms a bearish divergence now, this technical idea is going to gain more probability for me, personally.

Those pullbacks have repeatedly brought the S&P back towards its 100-week EMA band, which has acted as a pretty reliable trend support since 2023. It currently sits near the channel lows

What would get my attention?

I would want to see something like this:

  • S&P continues pushing higher, potentially even overshooting the channel.
  • Stochastic RSI fails to confirm the new high, creating daily TF bearish divergence.
  • Price then falls back inside the channel.

If that happens, the topping idea becomes much more interesting.

For now, we’re only at the awareness stage.

The setup is there, but the actual reversal signal isn’t.

Bullish scenario

If you’re an Elliott Wave trader, the current move could still be part of Wave 3, which would leave room for the S&P to break above this channel and extend considerably higher before a larger correction develops.

A sustained breakout above the channel would therefore weaken my bearish idea pretty quickly.

Keep in mind, we’re not trying to pick the top here. This is simply a technical structure worth paying attention to as it has produced some pretty useful signals over the last few years.

For now: Channel resistance is being tested. I remain neutral until I see a bearish divergence, or a sustained break above the channel.

Author

Zorrays Junaid

Zorrays Junaid

Alchemy Markets

Zorrays Junaid has extensive combined experience in the financial markets as a portfolio manager and trading coach. More recently, he is an Analyst with Alchemy Markets, and has contributed to DailyFX and Elliott Wave Forecast in the past.


More from Zorrays Junaid
Share:

Editor's Picks

AUD/USD bulls regain control above 0.6950 amid USD retreat

AUD/USD regains traction and extends the previous day's bounce from the weekly low, aiming for 0.7000 in Asia on Friday. The overnight pullback in US bond yields keeps the US Dollar below an 18-month high, which in turn offers some support to the pair. Meanwhile, hawkish RBA expectations also keep the major underpinned.

USD/JPY holds gains near 158.00 after Japan's weak Household Spending data

USD/JPY clings to gains around 158.00 after data showed on Friday that Japan's Household Spending fell for the ninth straight month, undermining the Japanese Yen. Meanwhile, the US Dollar remains depressed as the overnight fall in US bond yields counters a hawkish Fed and geopolitical uncertainties, could cap any downside in the pair.

Gold looks to regain $4,200 amid pre-US CPI repositioning

Gold is stretching higher toward $4,200 on Friday, extending recovery from two-month lows. US Dollar eases in tandem with Oil prices and Treasury yields, awaiting US sentiment data. The tide seems to be turning in favor of Gold, but the daily RSI is still bearish.


Ethereum drops below $2,500 as rising Treasury yields trigger selling pressure​
Ethereum (ETH) fell below $2,500 on Thursday, down nearly 4% and extending losses for a third consecutive day. The decline follows rising Oil prices and US Treasury yields over the past few days. The 10Y Note Yield reached a 24-year high at 5.35%, and the 30Y Note Yield climbed above 5.70% earlier on the day, sparking major distributions in the crypto market.
The inflation illusion: How government formulas shape the data
Every month, the government releases a barrage of economic statistics. Employment, inflation, consumer spending, economic growth, and countless other measurements are presented as objective facts that policymakers, investors, and the public can use to understand the economy. But what happens when the methodology used to produce those numbers changes?
The UK 30-year gilt just hit a 1998 high. Is that good or bad for the British Pound?
The yield on the UK's 30-year government bond, or gilt, went through 6% on October 1 for the first time since early 1998, and on Monday the Pound was at its strongest against the Euro since June 2025. The gilt market's 28-year high is mostly someone else's. Since early May, the 30-year gilt yield has risen about 0.15 of a percentage point and the US 30-year about 0.7.















