S&P 500 Index (SPX500USD) — Capped under 100% resistance Arc
S&P 500 Index (SPX500USD): Arc cycle analysis™
Overview
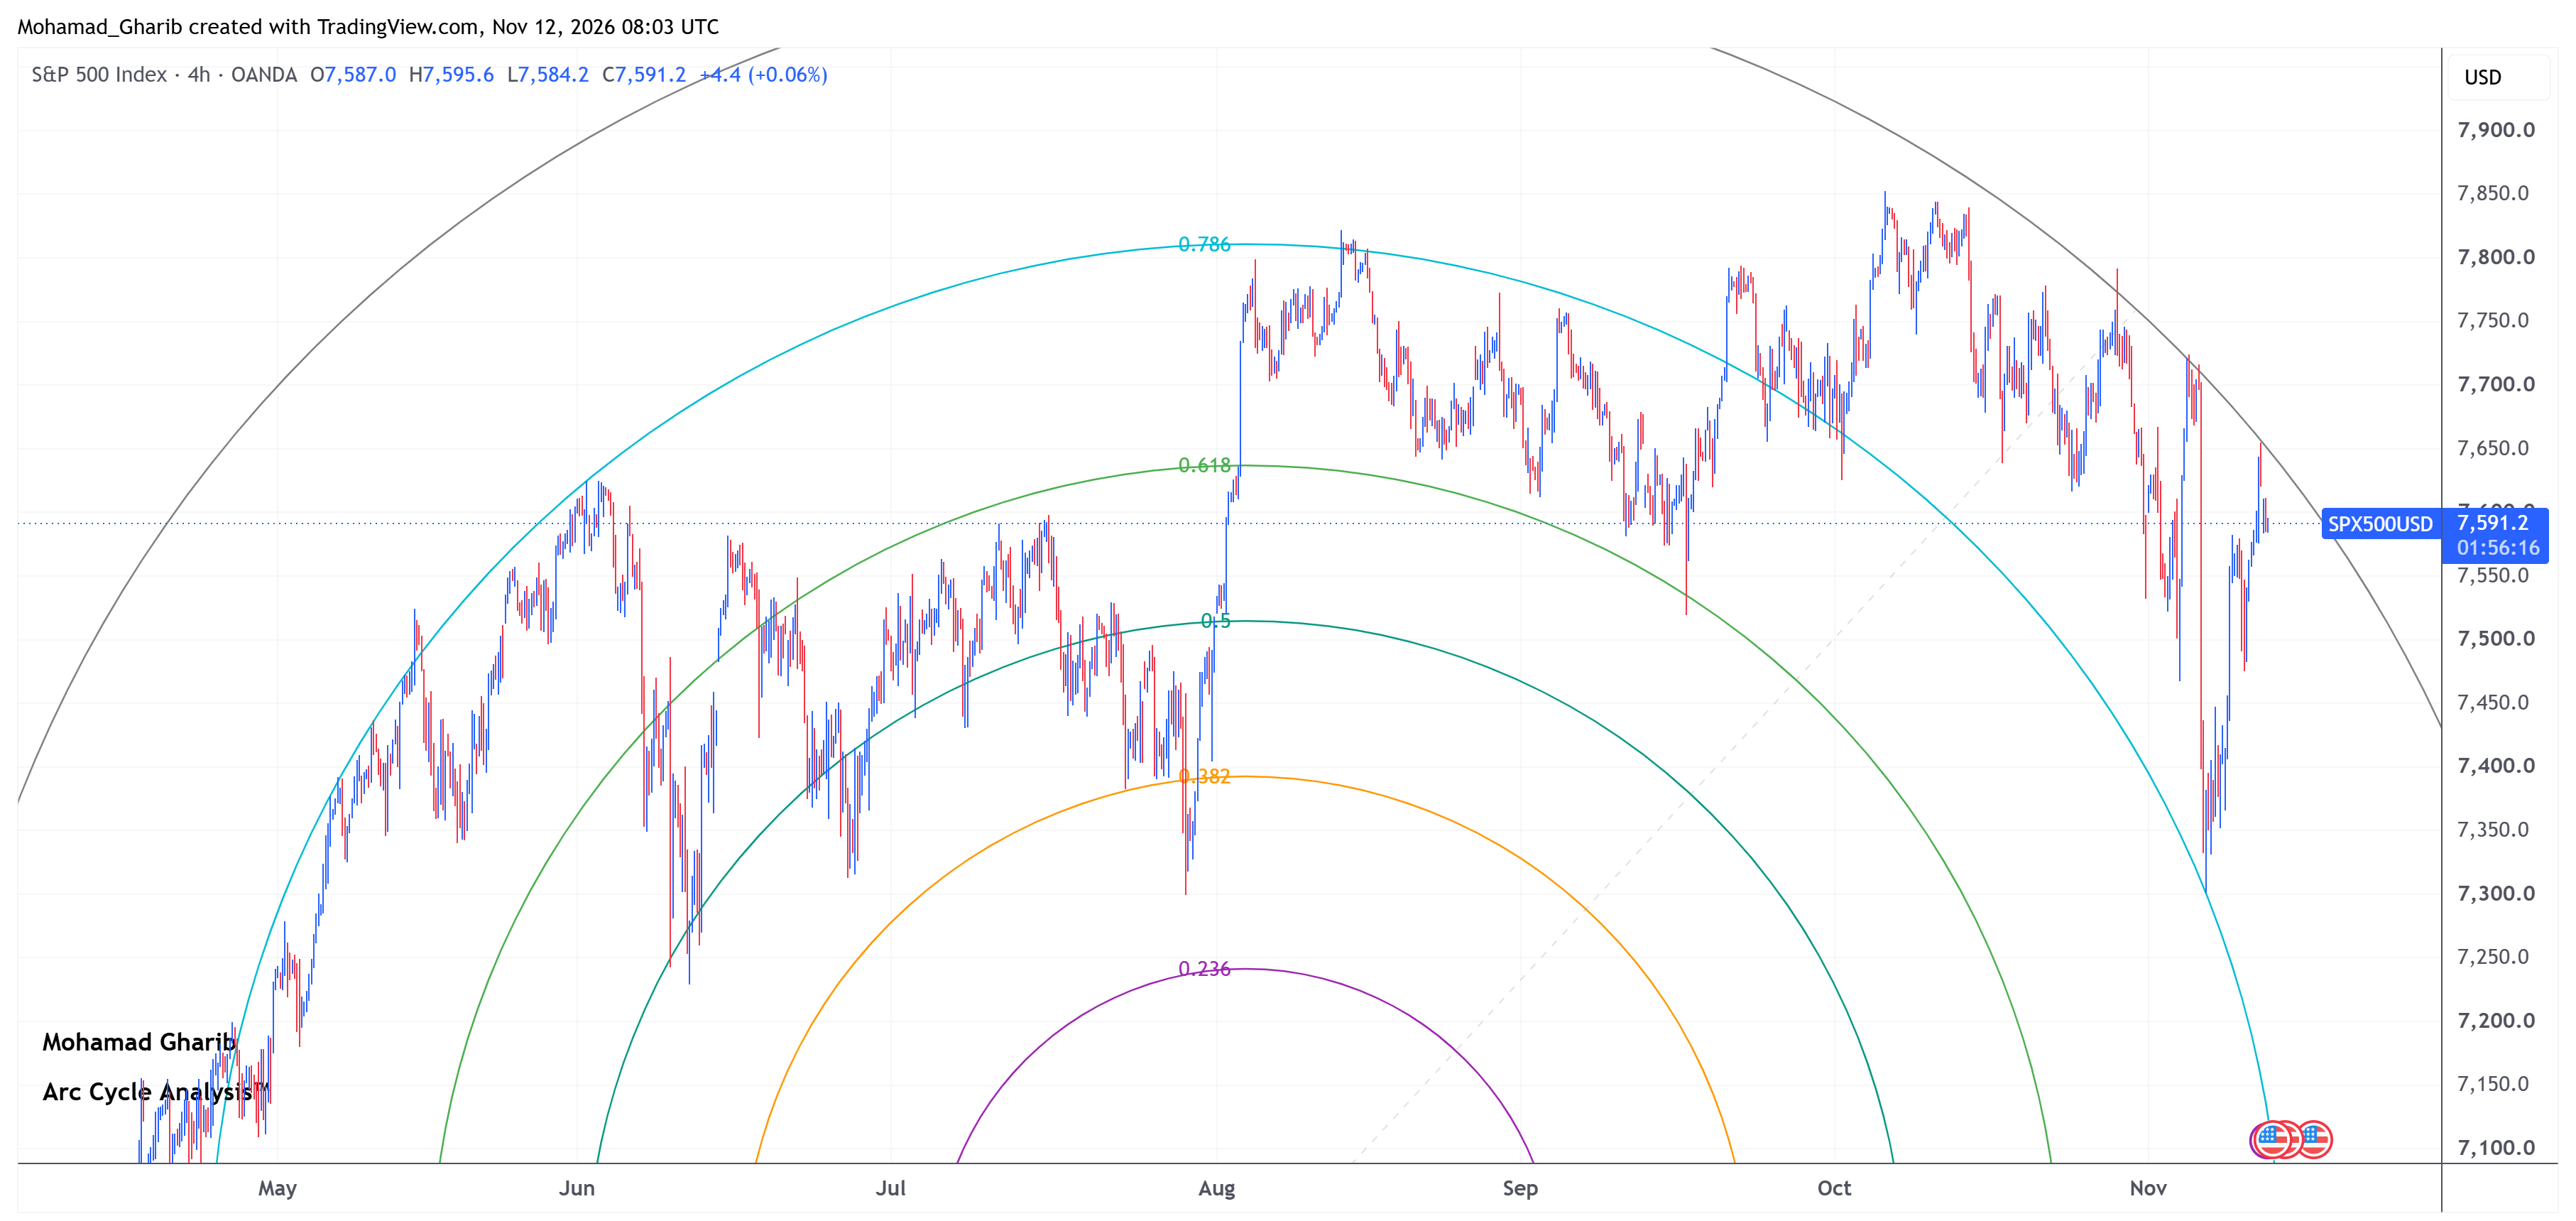
Based on Arc Cycle Analysis™ applied to the 4h chart, the S&P 500 Index remains capped under the 1 (100%) Resistance Arc, which continues to act as strong resistance. No signal has been confirmed yet, and the preferred approach is to await a clear reaction at the Arc before anticipating the next directional move.
Table 1: SPX500USD Arc cycle analysis summary
Metric | Reading |
Market Bias | Neutral |
Preferred Scenario | Awaiting Directional Confirmation |
Upside Confirmation | Sustained 4h close above 7,700 |
Downside Confirmation | Sustained 4h close below 7,500 |
Current Arc Level | 1 (100%) Resistance Arc |
Cycle Status | Testing Resistance Arc |
Arc Behavior | Strong Resistance |
Table 1: Key Arc Cycle readings for SPX500USD. Source: Arc Cycle Analysis™ by Mohamad Gharib.
Market outlook
The S&P 500 Index remains capped under the 1 (100%) Resistance Arc, which continues to act as strong resistance within the current arc cycle. No signal has been confirmed yet, and the market is awaiting a clear reaction at this Arc before a directional move can be determined. A sustained 4h close above 7,700 would confirm an upside breakout, while a sustained 4h close below 7,500 would confirm the rebound lower.
Author

Mohamad Gharib
Independent Analyst
Mohamad Gharib is a Financial Markets Analyst and Quantitative Researcher with more than 18 years of experience in financial markets, including 15 years as an FX Quant Trader.