S&P 500 faces a bearish september setup as seasonality aligns with a possible five-wave drop toward 7,100–7,200

Summary: The seasonal backdrop and the daily Elliott Wave structure are starting to point in the same direction: if this week’s low gives way, a larger decline toward the 7,100–7,200 zone becomes the highest-probability path on the chart.
September is the market’s weakest month
Since 1928, the S&P 500’s average September return is roughly -1.2%, and it is the only calendar month with a negative long-term average. It has finished lower in about 56% of those years. The last decade has not repaired that reputation: September’s recent average remains negative, and the declines in weak years have been large enough to keep the mean below zero.
Figure 1. Seasonal trend of the S&P 500
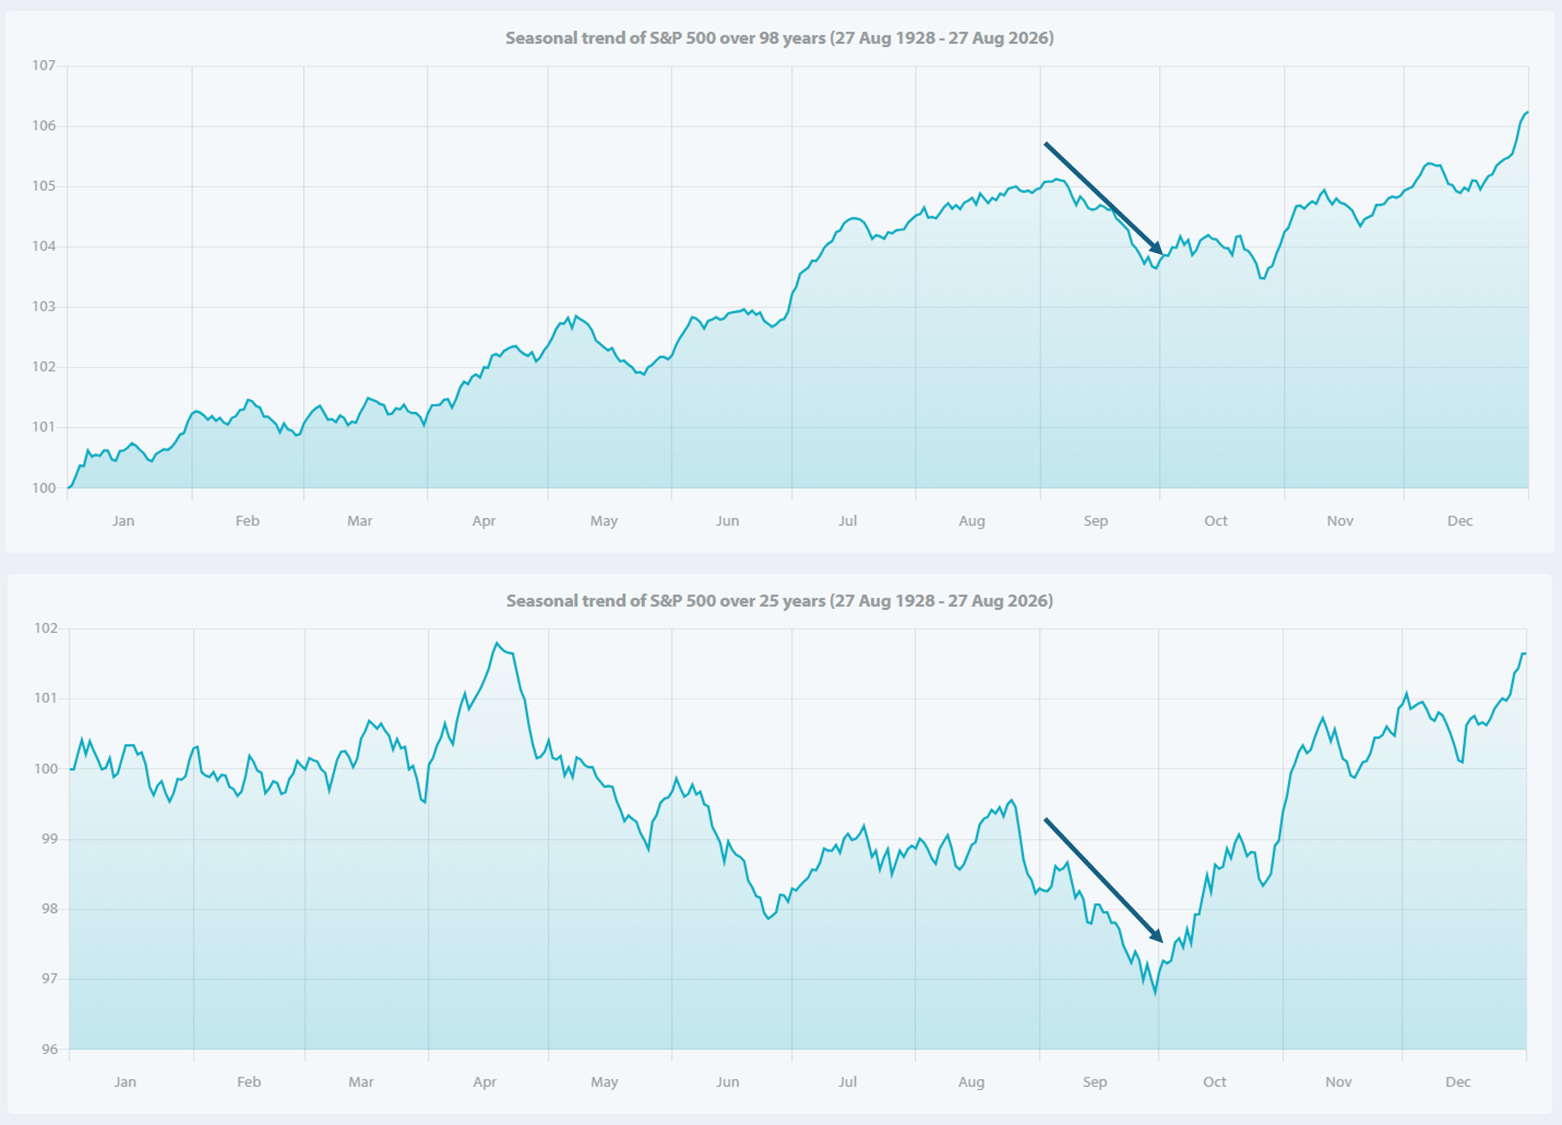
The 98-year seasonal composite, measured from Aug. 27 through the following year-end, shows the index typically peaking in late August, then sliding through September into early October before the year-end bid returns. The arrow on that long-term composite marks the late-August/early-September rollover, which is now due.
The 25-year composite is more aggressive. After a late-August bounce, the average path drops sharply through September, bottoming near the end of the month before the October–December rally takes over. In that more recent window, the September slide is not a shallow drift. It is the steepest decline of the year.
2026 is also a U.S. midterm election year, and that overlay does not help the bulls. Midterm years have historically been the weakest year of the presidential cycle, with the largest average intra-year drawdown often concentrated in the August–October window. Over the last 10 midterm Septembers, the S&P 500 was negative six times, averaging about -2%. Since 1942, midterm years have also shown a negative September average, with October more often the turning month and the post-election November–June window the reliable recovery phase. Seasonality is not a trade signal on its own. It is a headwind, and right now it aligns with the daily structure.
A possible bearish Elliott Wave count aligns with seasonality
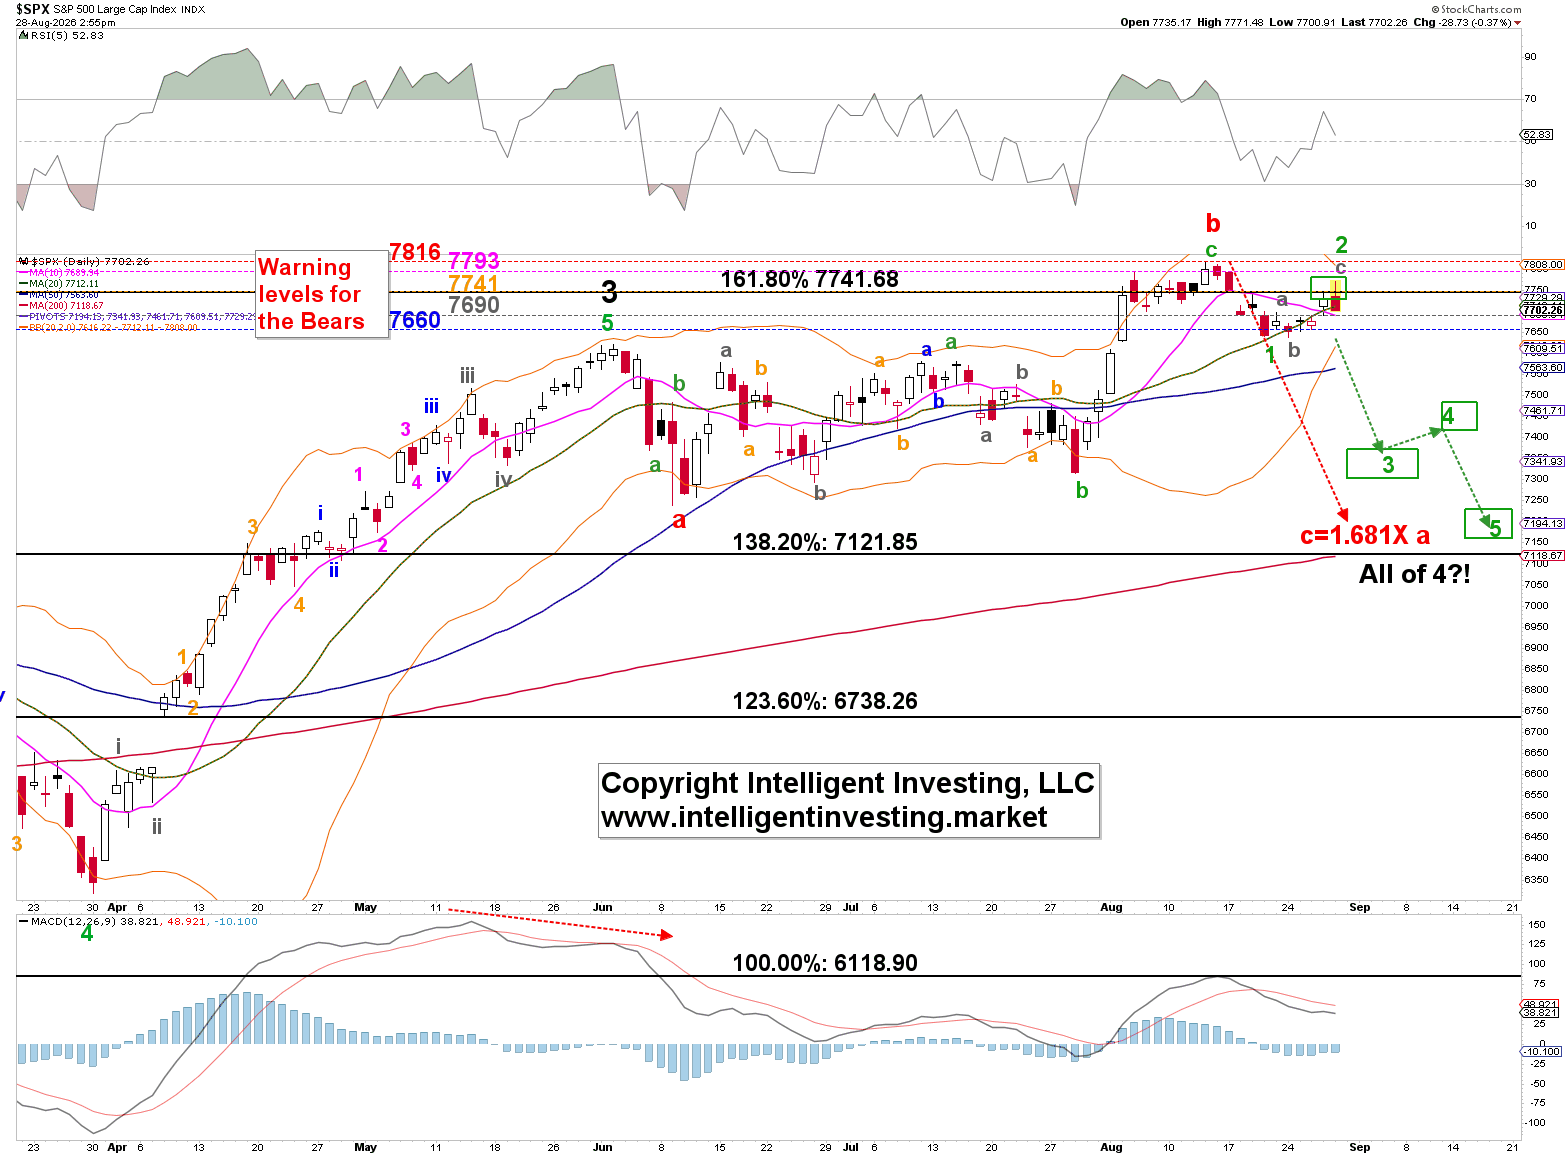
The preferred daily count treats the mid-August high as the end of a larger rally, labeled wave 5 of W-3. The first sell-off from that high appears to be (red) wave a, the complex bounce into August is (red) wave b, and the next break lower would be (green) wave 3 of (red) W-c of W-4; the start of a five-wave decline.
Figure 2. S&P 500 daily Elliott Wave map
Two downside paths are marked:
- The red overall path treats the decline as a c-wave equal to 1.68 times wave a, targeting the 138.2% extension at 7,121.85. That is the “c = 1.681 × a” line on the chart and sits just above the rising 200-day moving average, now near 7,119.
- The green detailed path treats the recent 3-4 day bounce as only wave 2 of W-c. A break of this week’s low would open wave 3 into the 7,300–7,360 area, a wave-4 bounce, then wave 5 toward 7,190. That five-wave sequence lands in the same 7,100–7,200 zone.
Either way, the 7,122 Fibonacci line, the 200-day SMA, and the “All of 4?!” box cluster in the same area. That is why 7,100–7,200 is the level that matters if the week’s low fails.
The trigger is this week’s low
As long as SPX holds above 7,638, the recent bounce can still be viewed as a more constructive bullish pattern, not shown, targeting ~7940 on a daily close back through today’s high. A break below this week’s low shifts the burden of proof. It would confirm that the rebound failed beneath the August highs and that the next swing is impulsive to the downside. In that case, a five-wave decline into 7,100–7,200 is not an outlier. It is the measured move already drawn on the chart.
Technicals below the count are not stretched. RSI(5) is near 53. The 10- and 20-day moving averages have flattened around 7,689–7,712. MACD is rolling over, with a negative histogram. This pattern is consistent with a market that has lost upside momentum and is deciding whether this week’s low is a springboard or the start of the September leg.
How to read the next few sessions
Seasonality indicates that September is the weakest month of the year, and the midyear version of that pattern is usually worse, not better. The Elliott Wave count suggests a five-wave decline toward 7,121–7,190 as the clean measured target if 7,638 breaks. These two observations reinforce each other, but price still needs to confirm.
Hold the week’s low, and the index can still grind back to new ATHs. Lose the week’s low on an expanding range, and the seasonal September slide and the wave-c / wave-3–5 path toward 7,100–7,200 become the trade.
Author

Dr. Arnout Ter Schure
Intelligent Investing, LLC
After having worked for over ten years within the field of energy and the environment, Dr.

















