S&P 500 extends irregular B‑wave rally toward key 7120

In our previous update from April 1 about the SP500, we concluded based on the Elliott wave, market breadth, and seasonality that “the [wave] W-b rebound into the April 18-28 time frame is now underway.”
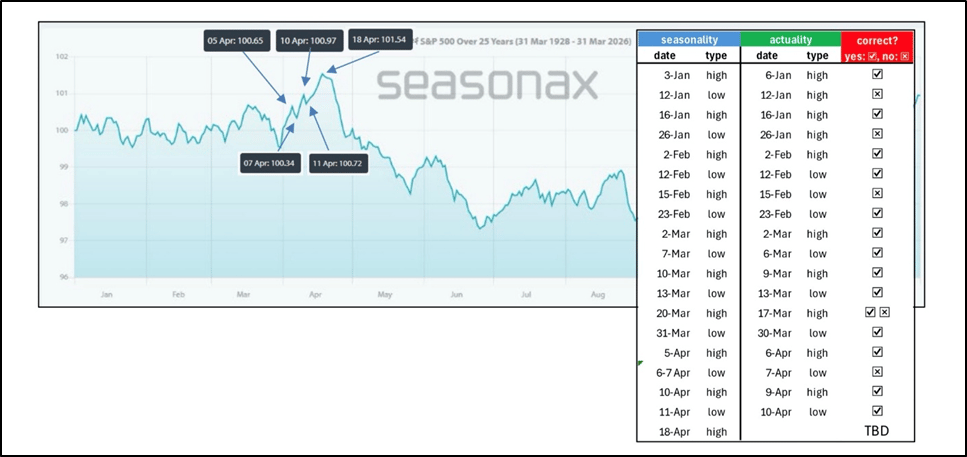
Back then, we identified the common target, based on typical Fibonacci retracements of the prior decline (Wave-a) at 61.8-76.4%, along with prior support and resistance levels, as $6800-6900. However, this was exceeded this week, and it’s crucial to recognize that the SP500’s behavior aligns with historical patterns seen during irregular B-waves. The sharp move above the retracement zone, combined with new all-time highs and the $7120 level as we approach the mid-term election year's average turn date on approximately April 18, now requires extra attention. Notably, the current stock market has adhered to this pattern 75% of the time. See figure 1 below.
Figure 1. Mid-term election year seasonality
Past instances in 2011, 2018, and 2020, which were also irregular flat 4th waves, illustrate how these B-waves often compensate for missed targets in the preceding third wave, resulting in a pronounced push before a potential reversal. In this case, the $7120 level is the 138.2% extension of Wave-1 (the rally from the 2020 low to the 2021 high), measured from the 2022 low (W-2), a common target for the 3rd wave. It was missed in January by about 120p (7002 vs 7120). Fast-forward to today, and the index has reached and exceeded it. See Figure 2 below.
Figure 2. Intermediate-term Elliott Wave count with technical indicators for the SP500
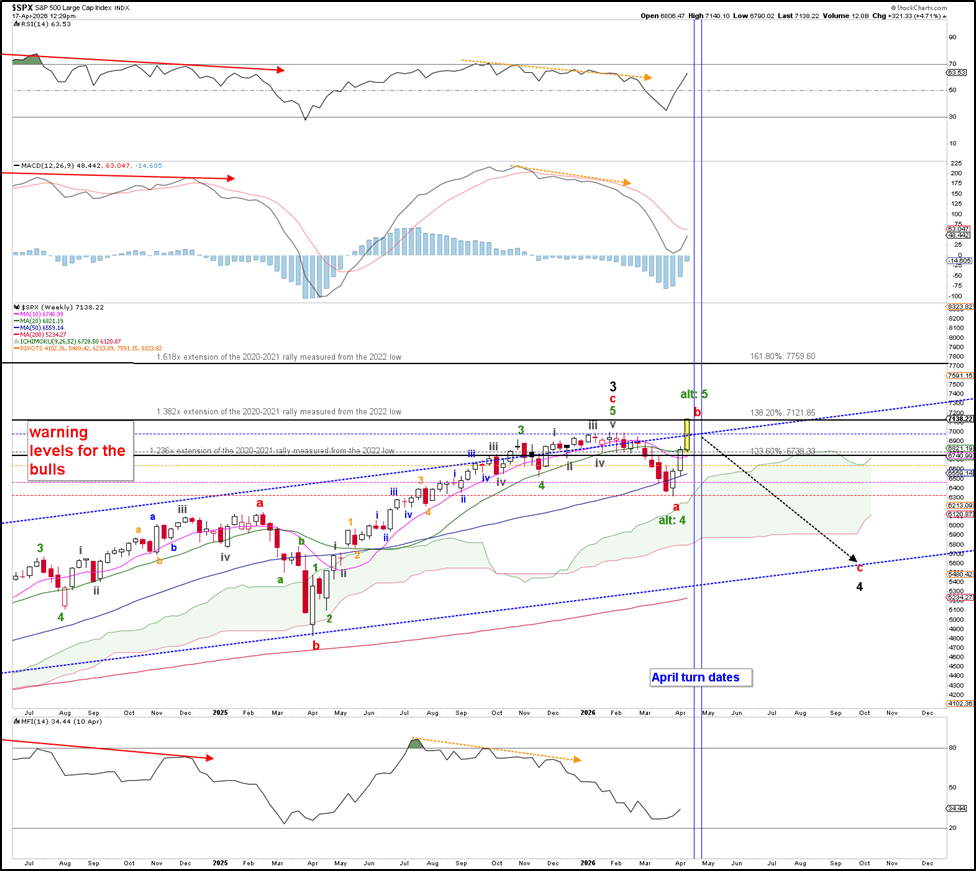
Therefore, we could count the March low as a 4th wave, with a 5th wave underway, as indicated by the green “alt: 4, alt: 5” labels. Also, the 5th wave, like a B-wave, is a terminal wave.
As such, traders and investors should remain attentive, especially given the confluence of the Elliott wave with seasonality, which has been 75% reliable this year. As April 18 approaches, we continue to monitor for signs of exhaustion and/or a reversal among our premium members, as we did at the end of March, as that will be essential for managing risk and capitalizing on potential trend shifts.
Author

Dr. Arnout Ter Schure
Intelligent Investing, LLC
After having worked for over ten years within the field of energy and the environment, Dr.