SP 500 Elliott Wave: Sloppy start to downtrend

Executive summary
- Topping Trend: SPX may have topped at $7,002.
- Potential Target: $6,079 – 38.2% Fibonacci retracement of the 2025-26 rally.
- Wave Count: Leading diagonal decline wave (i) or (a) in March 2026
SPX continues to decline from the 2026 high in a methodical pattern. Back on February 18, we forecasted a decline to 6,521 and SPX has nearly reached that level.
Current Elliott Wave analysis
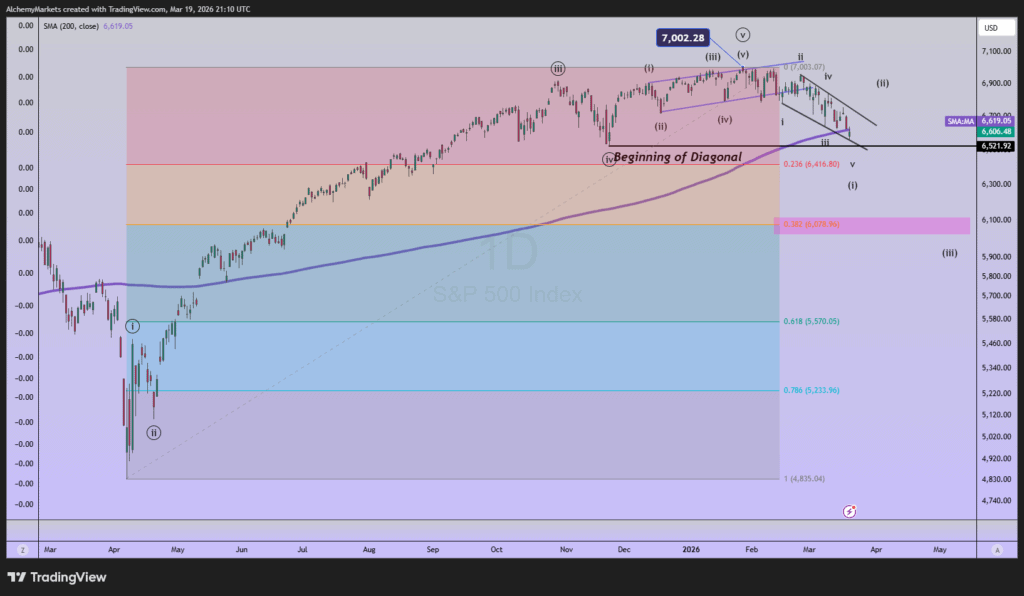
The minimum waves are visible to count a completed Elliott Wave ending diagonal pattern in place at the Jan 28 high. The ending diagonal pattern started at $6,521 on November 21 and appears to have completed in truncation at $7,002 on January 28.
The decline since then has been very sloppy and overlapping, hinting at a leading diagonal to start a new downtrend. Diagonals are shaped like wedges, and in this case, a declining wedge.
If this analysis is correct, the leading diagonal wave (i) is nearly complete and would lead to a partial rally in wave (ii) within the next few days.
Currently, SPX has fallen below the 200 day simple moving average for the first time since May 9, 2025. I suspect it may recover this line but only briefly.
The larger trend appears pointed to the downside with the next target coming near 6,079 were the 38.2% Fibonacci retracement level sits. Even lower levels are possible.
Bottom line
SPX appears to have topped on January 28 at $7,002 in an ending diagonal pattern. Since then, an overlapping leading diagonal appears to have developed suggesting that the current downtrend is not over. Under this model, rallies would hold below $7,002 and possibly push to $6,078.
This forecast remains in force will SPX remains below $7,002. If price moves above $7,002, then we’ll reconsider alternate Elliott wave counts.
Author

Zorrays Junaid
Alchemy Markets
Zorrays Junaid has extensive combined experience in the financial markets as a portfolio manager and trading coach. More recently, he is an Analyst with Alchemy Markets, and has contributed to DailyFX and Elliott Wave Forecast in the past.