Silver Price Forecasts: XAG/USD holds below $59.00 despite US Dollar’s weakness
- XAG/USD pulls back to $58.50 on Wednesday after failing to find acceptance above $59.00.
- The risk-off mood amid escalating tensions in Iran has offset the impact of a weaker US Dollar.
- The technical picture shows fading downside pressure, yet with bulls subdued.
Silver (XAG/USD) ticks lower on Wednesday, trading at $58.50 at the time of writing, after rejection at the $59.00 area on Tuesday. The sour market sentiment amid rising hostilities in Iran continues to weigh on the precious metal, offsetting the positive impact of a weaker US Dollar Index (DXY).
The Dollar extended losses on Tuesday, following a softer-than-expected Consumer Price Index (CPI) report, which cooled market expectations of immediate Federal Reserve (Fed) rate hikes. Fed Chairman Kevin Warsh maintained a hawkish tone in his first congressional testimony, assuring that the central bank will not tolerate persistent inflationary pressures, but he failed to lift the US Dollar.
Risk appetite, on the other hand, remains subdued as tensions escalate in Iran. The US military resumed the blockade of the Strait of Hormuz for Iranian vessels, and US President Donald Trump threatened to target civilian infrastructure, like power plants and bridges. Tehran, in turn, has threatened the closure of other energy routes. Oil prices steadied right below one-month highs, and precious metals pulled back amid the sour market sentiment.
Technical Analysis: Silver threads water below the key $61.00 area
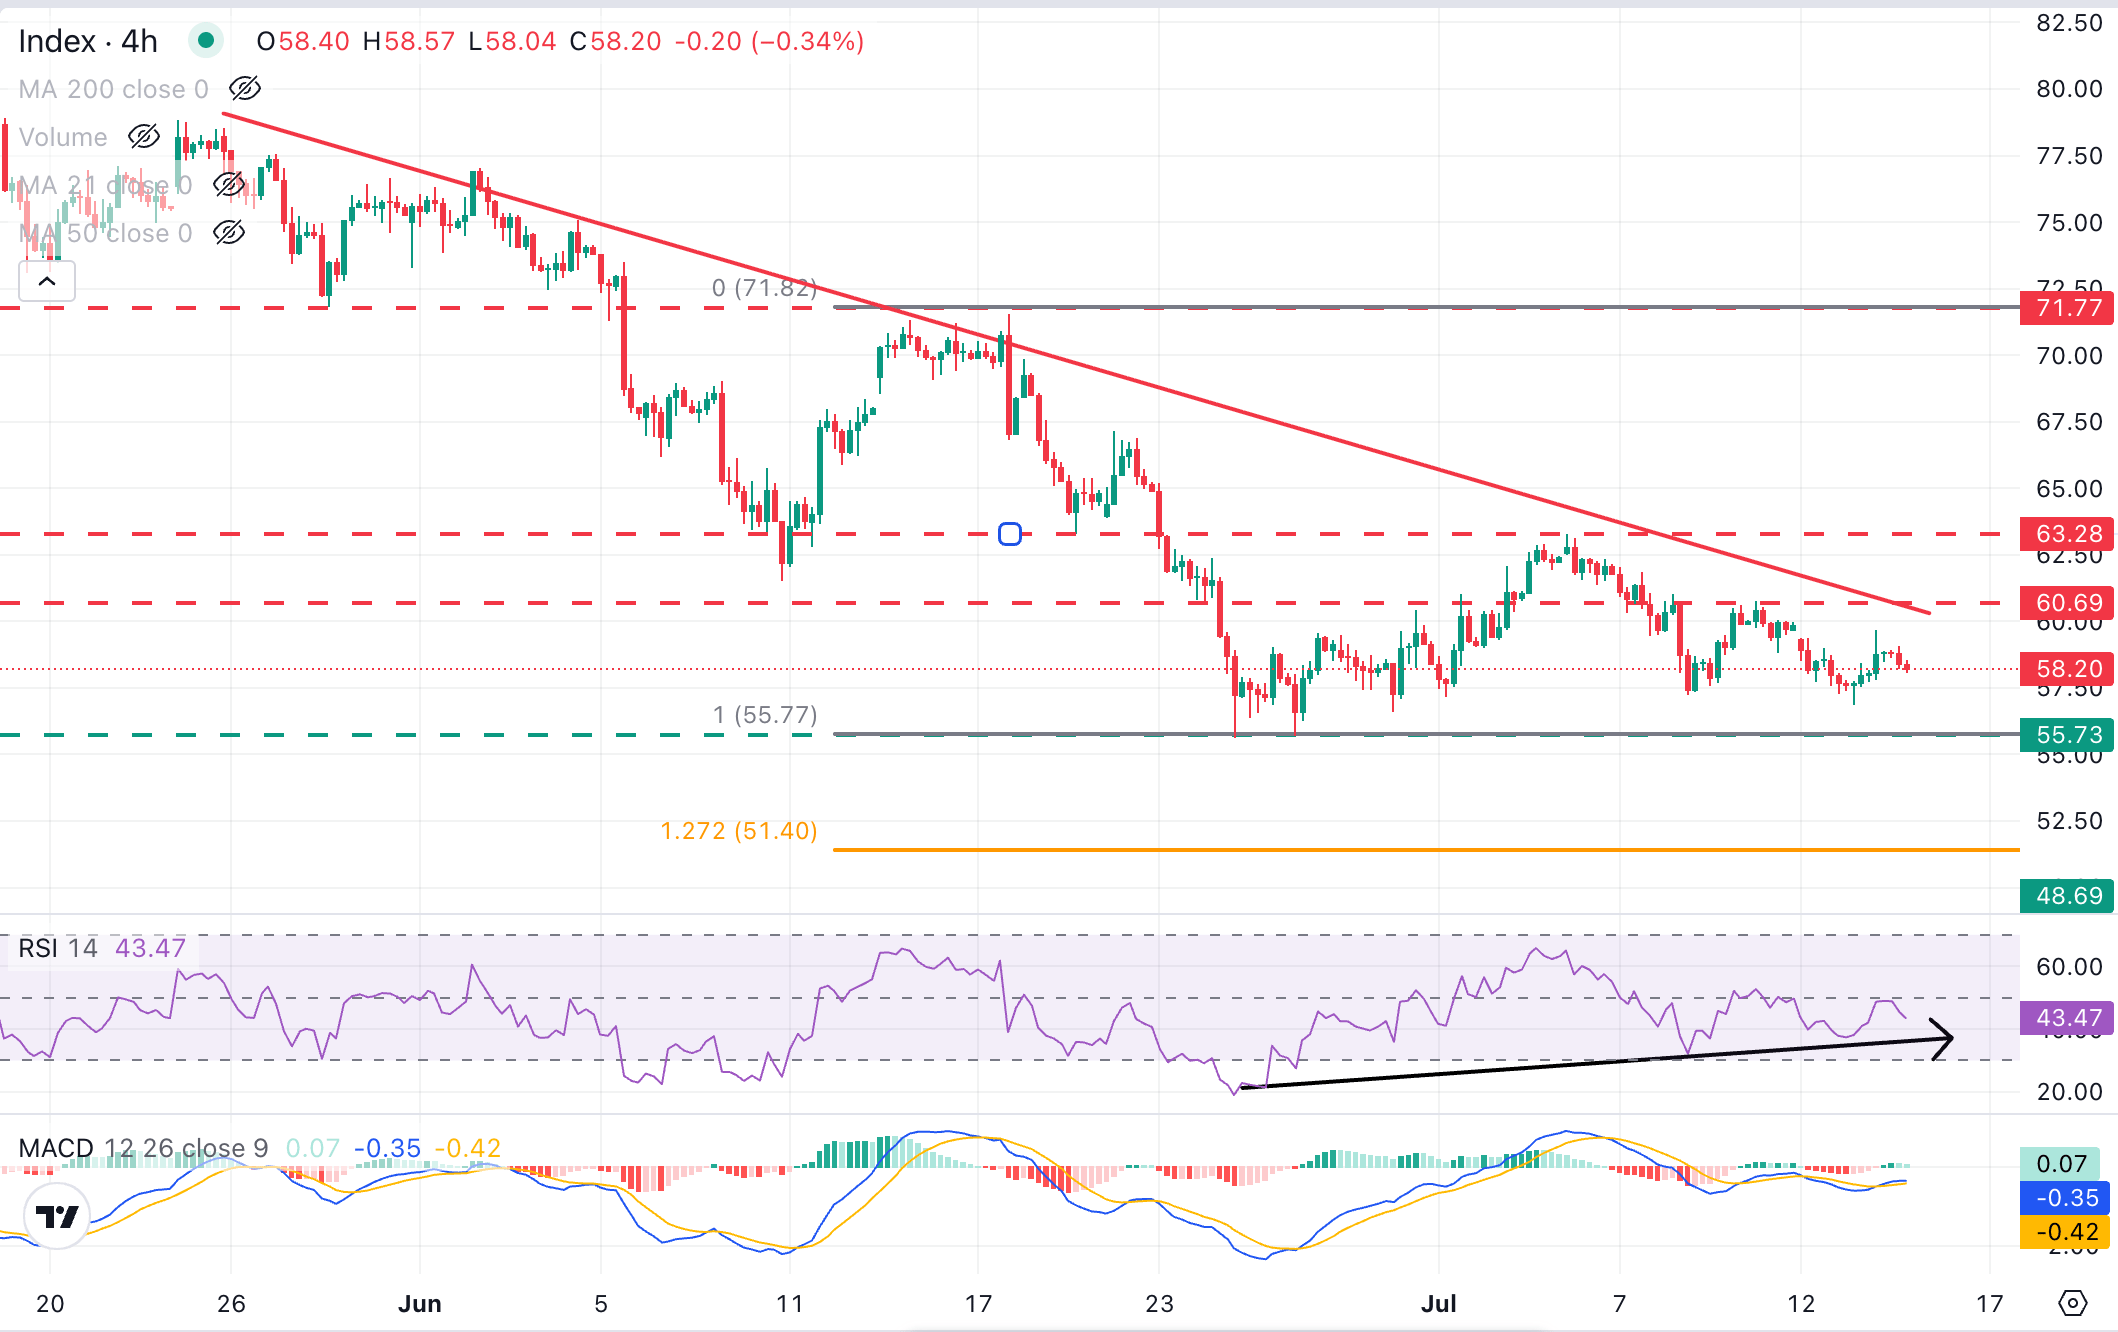
In the four-hour chart, XAG/USD trades at $58.32, holding below the descending trendline resistance from late-May highs. A bullish divergence on the Relative Strength Index (14), which has reached the neutral area near 45, and a slightly positive Moving Average Convergence Divergence (MACD) hint at fading downside momentum, although bullish attempts remain shallow for now.
Bulls should break the confluence of the mentioned trendline and the July 9 highs in the $61.00 area before July's trading top at the $63.30 area to confirm a trend shift. On the downside, initial support is seen at the late June lows around $55.70. A bearish reaction below these levels would expose the 127.2% Fibonacci extension of the late-June sell-off, at $51.40.
(The technical analysis of this story was written with the help of an AI tool. Know more.)
Silver FAQs
Silver is a precious metal highly traded among investors. It has been historically used as a store of value and a medium of exchange. Although less popular than Gold, traders may turn to Silver to diversify their investment portfolio, for its intrinsic value or as a potential hedge during high-inflation periods. Investors can buy physical Silver, in coins or in bars, or trade it through vehicles such as Exchange Traded Funds, which track its price on international markets.
Silver prices can move due to a wide range of factors. Geopolitical instability or fears of a deep recession can make Silver price escalate due to its safe-haven status, although to a lesser extent than Gold's. As a yieldless asset, Silver tends to rise with lower interest rates. Its moves also depend on how the US Dollar (USD) behaves as the asset is priced in dollars (XAG/USD). A strong Dollar tends to keep the price of Silver at bay, whereas a weaker Dollar is likely to propel prices up. Other factors such as investment demand, mining supply – Silver is much more abundant than Gold – and recycling rates can also affect prices.
Silver is widely used in industry, particularly in sectors such as electronics or solar energy, as it has one of the highest electric conductivity of all metals – more than Copper and Gold. A surge in demand can increase prices, while a decline tends to lower them. Dynamics in the US, Chinese and Indian economies can also contribute to price swings: for the US and particularly China, their big industrial sectors use Silver in various processes; in India, consumers’ demand for the precious metal for jewellery also plays a key role in setting prices.
Silver prices tend to follow Gold's moves. When Gold prices rise, Silver typically follows suit, as their status as safe-haven assets is similar. The Gold/Silver ratio, which shows the number of ounces of Silver needed to equal the value of one ounce of Gold, may help to determine the relative valuation between both metals. Some investors may consider a high ratio as an indicator that Silver is undervalued, or Gold is overvalued. On the contrary, a low ratio might suggest that Gold is undervalued relative to Silver.
Author

Guillermo Alcala
FXStreet
Graduated in Communication Sciences at the Universidad del Pais Vasco and Universiteit van Amsterdam, Guillermo has been working as financial news editor and copywriter in diverse Forex-related firms, like FXStreet and Kantox.

















