Silver Price Forecasts: XAG/USD dips below $75.00 amid growing risk aversion
- Silver resumes its immediate downtrend and hits fresh 10-day lows below $75.00.
- The US-Iran standoff is hurting risk appetite and weighing on precious metals.
- XAG/USD bears are focusing on the Mid-April lows around $72.60.
Silver (XAG/USD) resumes its immediate bearish trend on Thursday, following a frail recovery attempt the previous day. The precious metal struggles amid a stronger US Dollar (USD), and dives to fresh 10-day lows below $75.00 with investors increasingly averse to risk as the US-Iran peace process stalls.
Iranian authorities announced on Thursday that they have collected the first tolls from ships passing the Strait of Hormuz, although they have not provided further details about the ships or their destinations. Previously, US President Donald Trump threatened to target vessels that pay Iranian authorities to cross the waterway.
On Wednesday, Iran seized at least two ships while the US military redirected at least three Iranian Oil tankers in the Indian Ocean. These actions are escalating the tensions between the two rival countries amid a complete absence of news about the next round of peace talks, which were scheduled to resume this week.
Technical Analysis: Potential bearish flag formation
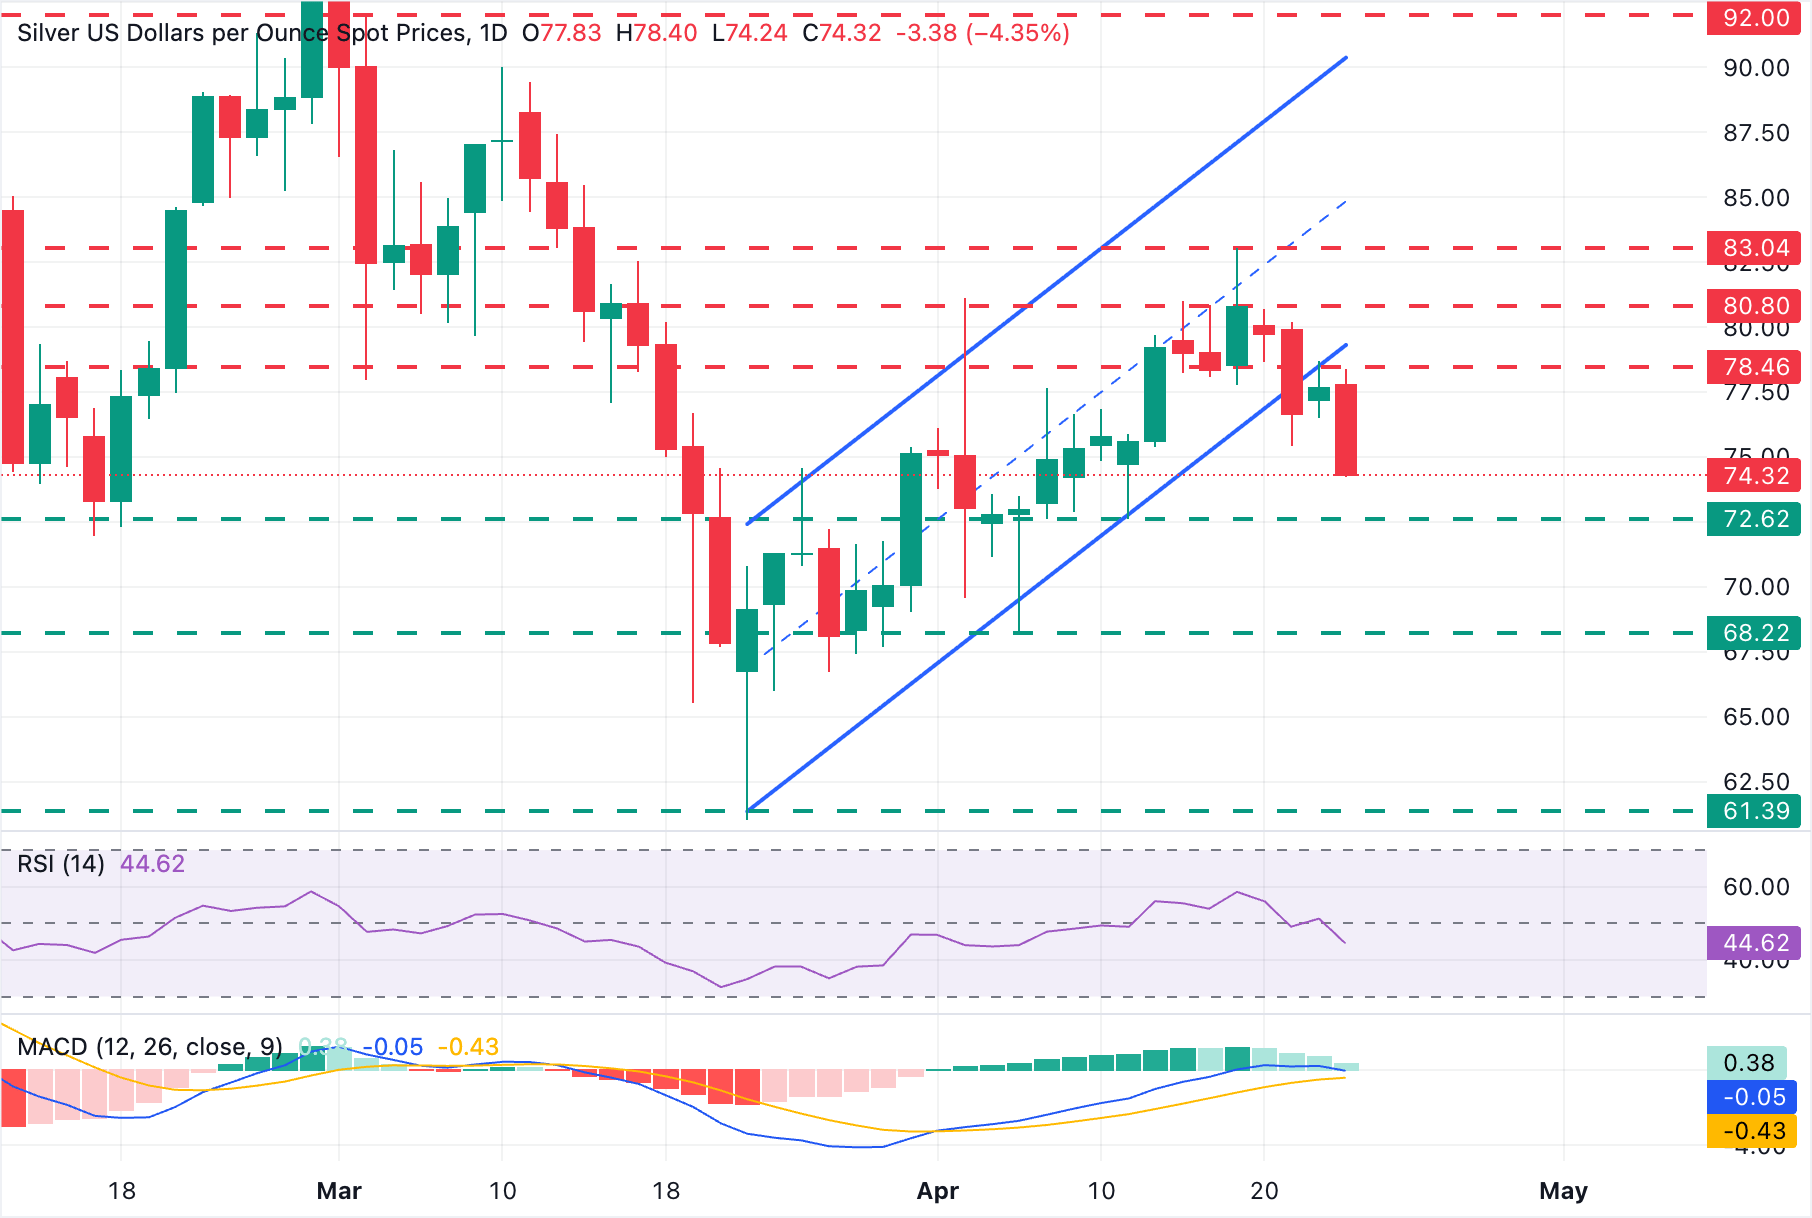
XAG/USD has broken below the bottom of the bullish channel from the late-March lows and is trading lower. Thursday's bearish candle on the daily chart highlights an impulsive reversal from a previous support area around the $78.50 level, confirming that sellers have taken control.
Technical indicators in the daily chart are mixed. The Relative Strength Index (RSI) has dropped below the 50 line, while the Moving Average Convergence Divergence (MACD) stays marginally positive, but the MACD line seems about to cross below the Signal line, altogether hinting at fading bullish momentum.
Bears are focusing on the $72.60 area, which provided support on April 8, 9, and 13, ahead of the $70.00 psychological level and the April 7 low, near $68.30. On the flip side, upside attempts are likely to be challenged at the mentioned $78.50 area and the reverse trendline, now around $79.50.
(The technical analysis of this story was written with the help of an AI tool.)
Silver FAQs
Silver is a precious metal highly traded among investors. It has been historically used as a store of value and a medium of exchange. Although less popular than Gold, traders may turn to Silver to diversify their investment portfolio, for its intrinsic value or as a potential hedge during high-inflation periods. Investors can buy physical Silver, in coins or in bars, or trade it through vehicles such as Exchange Traded Funds, which track its price on international markets.
Silver prices can move due to a wide range of factors. Geopolitical instability or fears of a deep recession can make Silver price escalate due to its safe-haven status, although to a lesser extent than Gold's. As a yieldless asset, Silver tends to rise with lower interest rates. Its moves also depend on how the US Dollar (USD) behaves as the asset is priced in dollars (XAG/USD). A strong Dollar tends to keep the price of Silver at bay, whereas a weaker Dollar is likely to propel prices up. Other factors such as investment demand, mining supply – Silver is much more abundant than Gold – and recycling rates can also affect prices.
Silver is widely used in industry, particularly in sectors such as electronics or solar energy, as it has one of the highest electric conductivity of all metals – more than Copper and Gold. A surge in demand can increase prices, while a decline tends to lower them. Dynamics in the US, Chinese and Indian economies can also contribute to price swings: for the US and particularly China, their big industrial sectors use Silver in various processes; in India, consumers’ demand for the precious metal for jewellery also plays a key role in setting prices.
Silver prices tend to follow Gold's moves. When Gold prices rise, Silver typically follows suit, as their status as safe-haven assets is similar. The Gold/Silver ratio, which shows the number of ounces of Silver needed to equal the value of one ounce of Gold, may help to determine the relative valuation between both metals. Some investors may consider a high ratio as an indicator that Silver is undervalued, or Gold is overvalued. On the contrary, a low ratio might suggest that Gold is undervalued relative to Silver.
Author

Guillermo Alcala
FXStreet
Graduated in Communication Sciences at the Universidad del Pais Vasco and Universiteit van Amsterdam, Guillermo has been working as financial news editor and copywriter in diverse Forex-related firms, like FXStreet and Kantox.