Silver Price Forecasts: XAG/USD dips below $58 weighed by higher US yields
- XAG/USD drifts below $58.00 and nears YTD lows in the area of 55.60.
- Precious metals struggle on Wednesday amid a sharp rise in US Treasury yields.
- US Job Openings beat expectations on Tuesday, adding to the case for Fed rate hikes.

Silver (XAG/USD) is trading lower on Wednesday, with the US Dollar buoyed by strong US macroeconomic data and higher US Treasury yields. The XAG/USD pair has retreated below $58.00 after failing to consolidate above the $60.00 area on Tuesday, and is drawing closer to the year-to-date (YTD) lows, near $55.60 hit in June.
Precious metals are struggling on Wednesday, following a jump in US Treasury yields. The yield of the benchmark US 10-year note has risen nine basis points to levels near 4.7%, with no clear reason other than month- and quarter-end portfolio adjustments. Treasury yields have an inverse correlation with the precious metals.
In the macroeconomic domain, recent data has continued feeding the narrative of US economic exceptionalism. Job Openings rose unexpectedly in May to their highest levels in two years, confirming the recovery of the US labour market. With investors ramping up bets on Federal Reserve (Fed) tightening, all eyes are on the US central bank’s chairman, Kevin Warsh, who is scheduled to speak at a central bankers’ meeting later on the day.
Technical Analysis: Looking for direction below $60.00
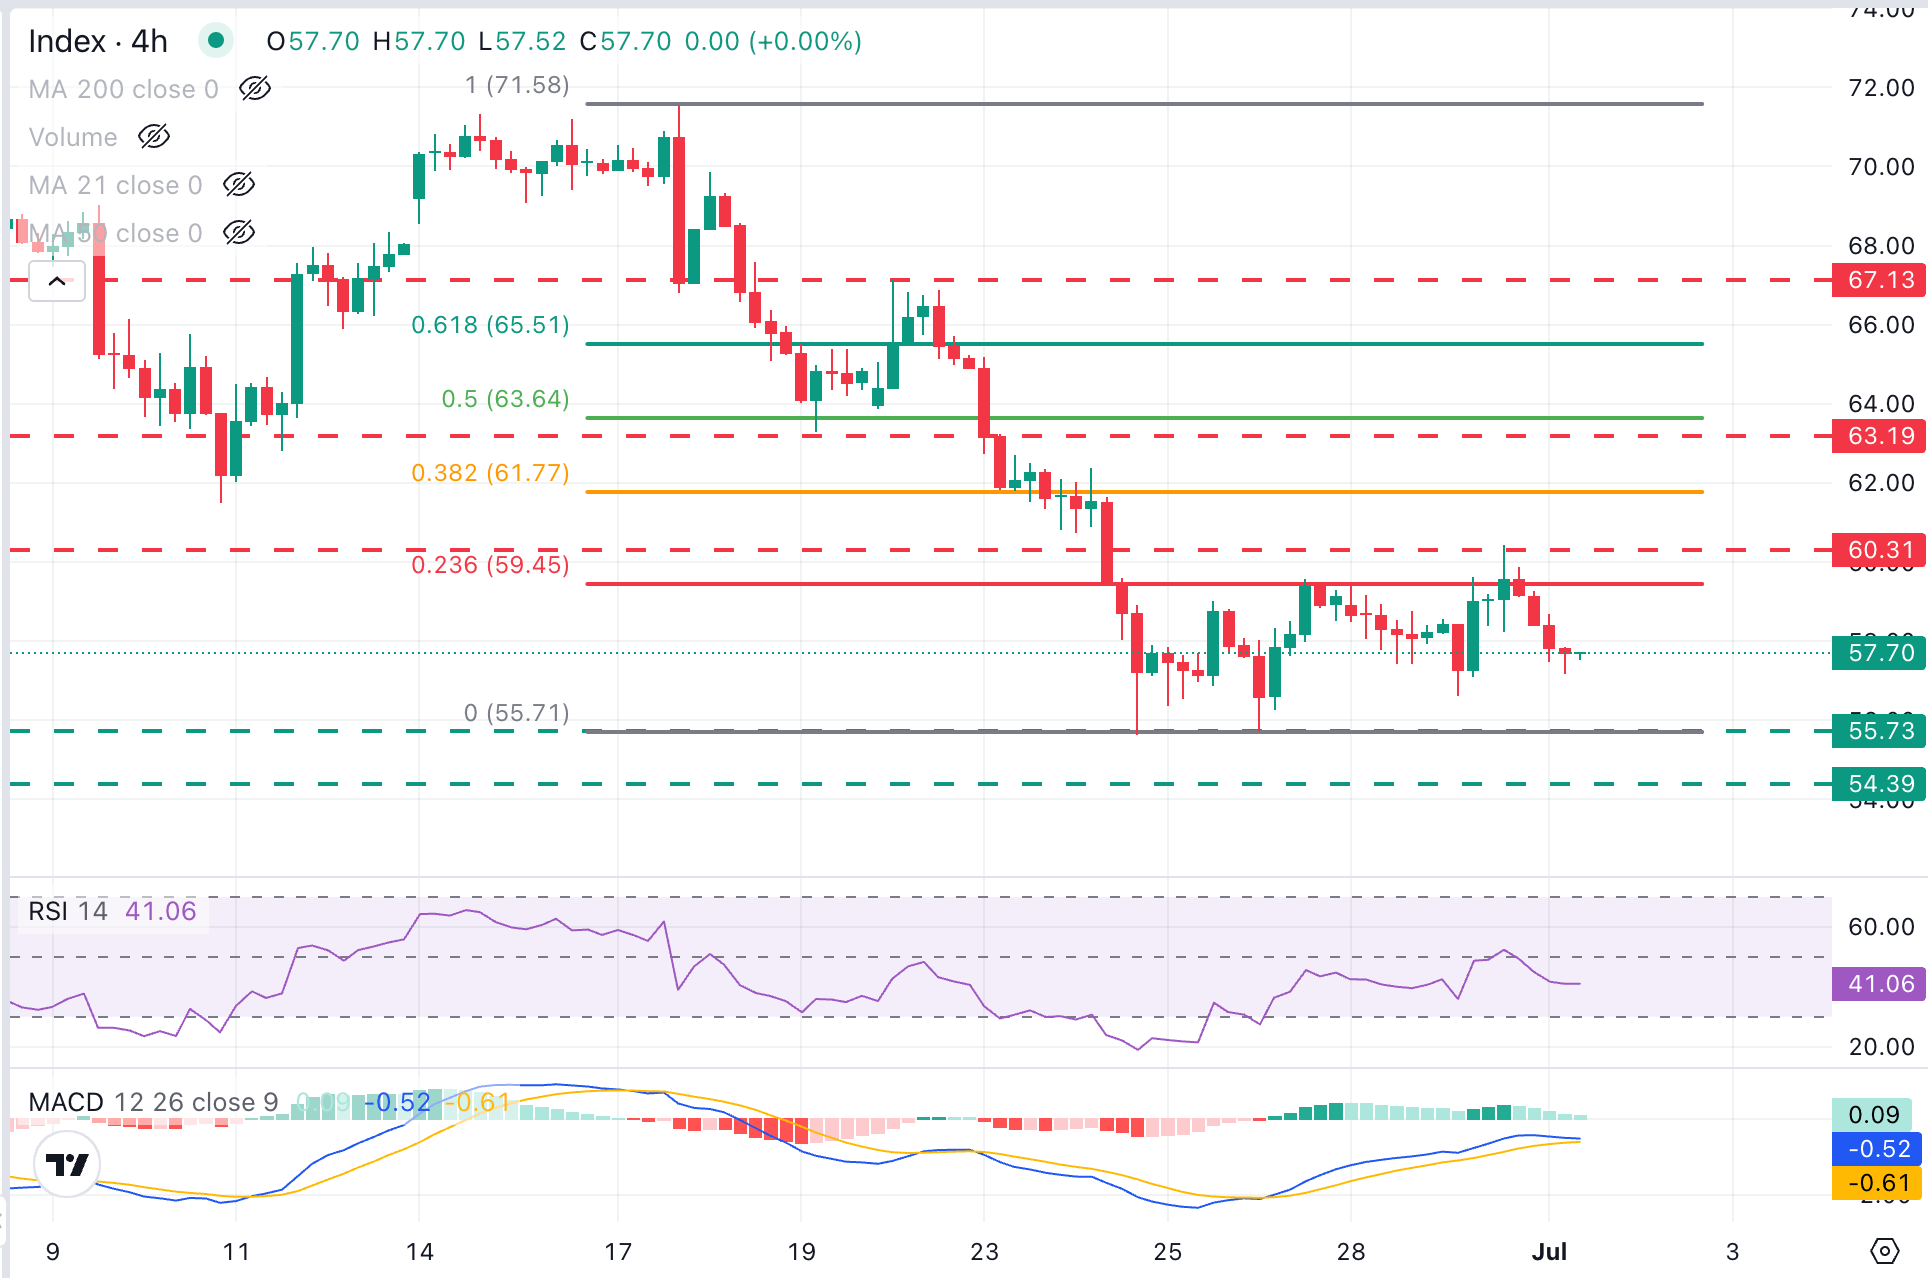
XAG/USD trades at $57.54, maintaining the broader bearish bias intact, although recent price action reveals a hesitant market. Momentum has improved, with the four-hour Relative Strength Index (14) lifting toward the 40 area and the Moving Average Convergence Divergence (MACD) turning modestly positive above zero, yet this merely hints at a corrective bounce rather than a trend shift.
Bears remain contained above Tuesday's low, in the $56.60 area so far, yet with the mentioned seven-month low at $55.71 at a short distance. A clear break of this level would bring the October and mid-November 2025 highs, at 54.86 and 54.39, into focus.
Upside attempts remain capped in the area between the 23.6% Fibonacci retracement at $59.45 and the $60.00 psychological area. Further up, the support area around $63.50, which held bears on June 19 and 21, is coincident with the 50% Fibonacci retracement and makes for the next potential target.
(The technical analysis of this story was written with the help of an AI tool.)
Silver FAQs
Silver is a precious metal highly traded among investors. It has been historically used as a store of value and a medium of exchange. Although less popular than Gold, traders may turn to Silver to diversify their investment portfolio, for its intrinsic value or as a potential hedge during high-inflation periods. Investors can buy physical Silver, in coins or in bars, or trade it through vehicles such as Exchange Traded Funds, which track its price on international markets.
Silver prices can move due to a wide range of factors. Geopolitical instability or fears of a deep recession can make Silver price escalate due to its safe-haven status, although to a lesser extent than Gold's. As a yieldless asset, Silver tends to rise with lower interest rates. Its moves also depend on how the US Dollar (USD) behaves as the asset is priced in dollars (XAG/USD). A strong Dollar tends to keep the price of Silver at bay, whereas a weaker Dollar is likely to propel prices up. Other factors such as investment demand, mining supply – Silver is much more abundant than Gold – and recycling rates can also affect prices.
Silver is widely used in industry, particularly in sectors such as electronics or solar energy, as it has one of the highest electric conductivity of all metals – more than Copper and Gold. A surge in demand can increase prices, while a decline tends to lower them. Dynamics in the US, Chinese and Indian economies can also contribute to price swings: for the US and particularly China, their big industrial sectors use Silver in various processes; in India, consumers’ demand for the precious metal for jewellery also plays a key role in setting prices.
Silver prices tend to follow Gold's moves. When Gold prices rise, Silver typically follows suit, as their status as safe-haven assets is similar. The Gold/Silver ratio, which shows the number of ounces of Silver needed to equal the value of one ounce of Gold, may help to determine the relative valuation between both metals. Some investors may consider a high ratio as an indicator that Silver is undervalued, or Gold is overvalued. On the contrary, a low ratio might suggest that Gold is undervalued relative to Silver.
Author

Guillermo Alcala
FXStreet
Graduated in Communication Sciences at the Universidad del Pais Vasco and Universiteit van Amsterdam, Guillermo has been working as financial news editor and copywriter in diverse Forex-related firms, like FXStreet and Kantox.


