Silver Price Forecast: XAG/USD surges to near $53 despite rising US bond Yields
- Silver price soars to near $53 despite sell-off US bond market.
- Hotter-than-expected US CPI data for October has boosted US Treasury yields.
- Commerzbank sees the US inflation remaining elevated next year too.
Silver price (XAG/USD) is up almost 3% to near $53.00 during the European trading session on Wednesday. The white metal rallies even as debate that the Federal Reserve (Fed) could deliver a supersize interest rate hike in the December policy meeting has heated, following the release of the hotter-than-projected United States (US) Consumer Price Index (CPI) data for October. This has resulted in a sharp increase in yields on US Treasuries
US inflation surprise keeps pressure on Treasuries
Strategists at Deutsche Bank highlight that the inflation data were the key catalyst for the latest bond selloff, noting that “that US CPI print drove the biggest moves of the day, with the monthly core CPI print for October above consensus at +0.30% (vs. +0.2% expected).”
Deutsche Bank points out that “moreover, it was the third consecutive month with core CPI at +0.3%, and if you take those three months together, the annualised pace for core CPI is running at +3.75%.” According to the bank, “that’s the fastest pace on that measure since April 2024, so it made it increasingly difficult to dismiss this as a blip.”
The bank also underscores that “meanwhile, the headline CPI numbers were faster still, with monthly headline CPI at +0.35% (vs. +0.3% expected), with the 3-month annualised pace at +5.72%.” In their view, “for markets, the clearest impact could be seen in US Treasuries, with yields surging across the curve.”
As of writing, 10-year US Treasury Yields are 2.4% higher at around 5%. Technically, higher yields on US interest-bearing assets diminish the appeal of non-yielding assets, such as Silver.
What are expectations for the US inflation outlook?
Economists at Commerzbank caution that US price pressures remain uncomfortably elevated, stressing that “prices are still rising too quickly, even though the increase was somewhat smaller than in September.” They highlight that “core inflation, a key gauge of the underlying trend, thus remains (too) high and is no longer trending downward,” underscoring their view that underlying price dynamics have stalled rather than continued to improve. In their assessment, “the strong economy and the ongoing conflict in the Middle East suggest that inflation is unlikely to ease in the near term,” and they judge that “inflation is not expected to decline until 2027, and even then, it is likely to remain above a level consistent with price stability.”
Such a scenario will likely keep the Silver price under pressure.
Silver Technical Analysis
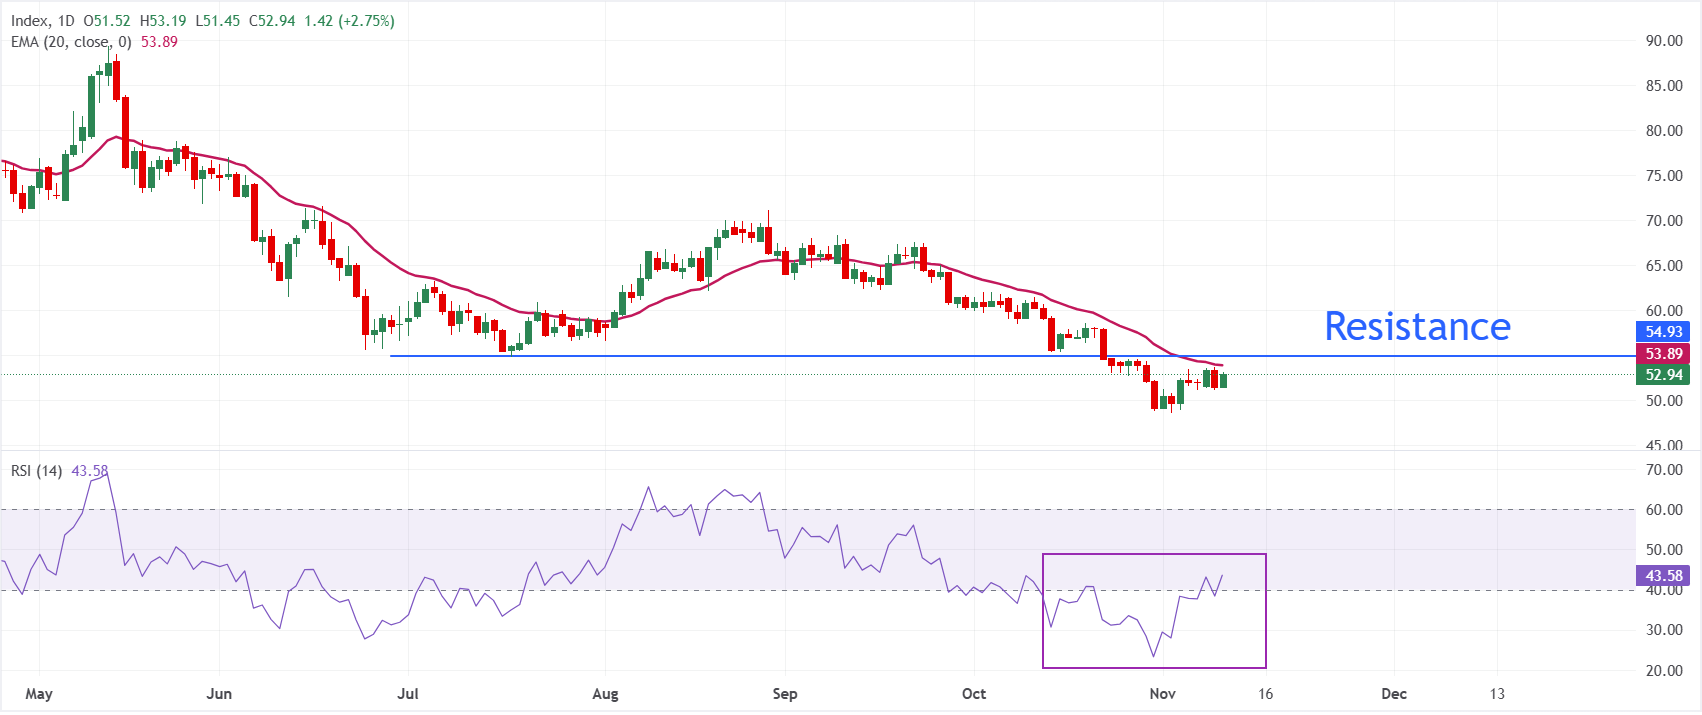
In the daily chart, XAG/USD trades at $52.94. The metal holds below the 20-day Exponential Moving Average (EMA) at $53.89, keeping the near-term tone bearish, as recent attempts to stabilize have not yet reclaimed this dynamic barrier. The Relative Strength Index (RSI) at 43.6 has recovered from oversold territory but remains below the 50 line, suggesting only modest easing in downside momentum rather than a confirmed shift in trend.
On the topside, initial resistance is defined by the 20-day EMA at $53.89, and a sustained break above this level would be needed to soften the current bearish bias and open the way for a more meaningful recovery. With no clear nearby structural supports derived from the provided indicators, the downside remains vulnerable while price trades beneath the EMA, leaving XAG/USD exposed to further weakness if sellers reassert pressure below recent lows.
(The technical analysis of this story was written with the help of an AI tool. Know more.)
Silver FAQs
Silver is a precious metal highly traded among investors. It has been historically used as a store of value and a medium of exchange. Although less popular than Gold, traders may turn to Silver to diversify their investment portfolio, for its intrinsic value or as a potential hedge during high-inflation periods. Investors can buy physical Silver, in coins or in bars, or trade it through vehicles such as Exchange Traded Funds, which track its price on international markets.
Silver prices can move due to a wide range of factors. Geopolitical instability or fears of a deep recession can make Silver price escalate due to its safe-haven status, although to a lesser extent than Gold's. As a yieldless asset, Silver tends to rise with lower interest rates. Its moves also depend on how the US Dollar (USD) behaves as the asset is priced in dollars (XAG/USD). A strong Dollar tends to keep the price of Silver at bay, whereas a weaker Dollar is likely to propel prices up. Other factors such as investment demand, mining supply – Silver is much more abundant than Gold – and recycling rates can also affect prices.
Silver is widely used in industry, particularly in sectors such as electronics or solar energy, as it has one of the highest electric conductivity of all metals – more than Copper and Gold. A surge in demand can increase prices, while a decline tends to lower them. Dynamics in the US, Chinese and Indian economies can also contribute to price swings: for the US and particularly China, their big industrial sectors use Silver in various processes; in India, consumers’ demand for the precious metal for jewellery also plays a key role in setting prices.
Silver prices tend to follow Gold's moves. When Gold prices rise, Silver typically follows suit, as their status as safe-haven assets is similar. The Gold/Silver ratio, which shows the number of ounces of Silver needed to equal the value of one ounce of Gold, may help to determine the relative valuation between both metals. Some investors may consider a high ratio as an indicator that Silver is undervalued, or Gold is overvalued. On the contrary, a low ratio might suggest that Gold is undervalued relative to Silver.
Author

Sagar Dua
FXStreet
Sagar Dua is associated with the financial markets from his college days. Along with pursuing post-graduation in Commerce in 2014, he started his markets training with chart analysis.