Silver Price Forecast: XAG/USD struggles for direction despite US-Iran deal hopes, softer US Dollar
- Silver trades flat despite broad US Dollar weakness and improving sentiment around a potential US-Iran deal.
- Uncertainty over a proposed US-Iran agreement keeps traders from placing aggressive bets.
- XAG/USD consolidates near the 50-day SMA as momentum indicators continue to show mixed signals.

Silver (XAG/USD) trades flat on Friday, failing to capitalize on improving market sentiment surrounding a potential US-Iran peace deal, even as the US Dollar (USD) slides to a two-week low. At the time of writing, XAG/USD trades around $75.60 and is on track to end the week virtually unchanged.
US President Donald Trump said on Friday that the naval blockade on Iranian ports would be lifted. Traders are now awaiting final approval on a reported 60-day memorandum of understanding (MOU) that would extend the current ceasefire and reopen the Strait of Hormuz.
In reaction, the Greenback gave up earlier gains. The US Dollar Index (DXY), which tracks the Greenback’s value against a basket of six major currencies, trades around the 98.80 mark after hitting a seven-week high of 99.54 on Thursday.
However, uncertainty around the deal remains high. Iran’s Fars News Agency rejected Trump’s latest comments on a possible deal and said no final decision has been made yet. The report also said the proposed agreement is still in the final stages of ratification in Iran.
The subdued price action in Silver contrasts with Gold, which climbed more than 1.5% on Friday. Traders are avoiding aggressive bets while waiting for more clarity on whether a deal can be reached soon.
Technical Analysis:
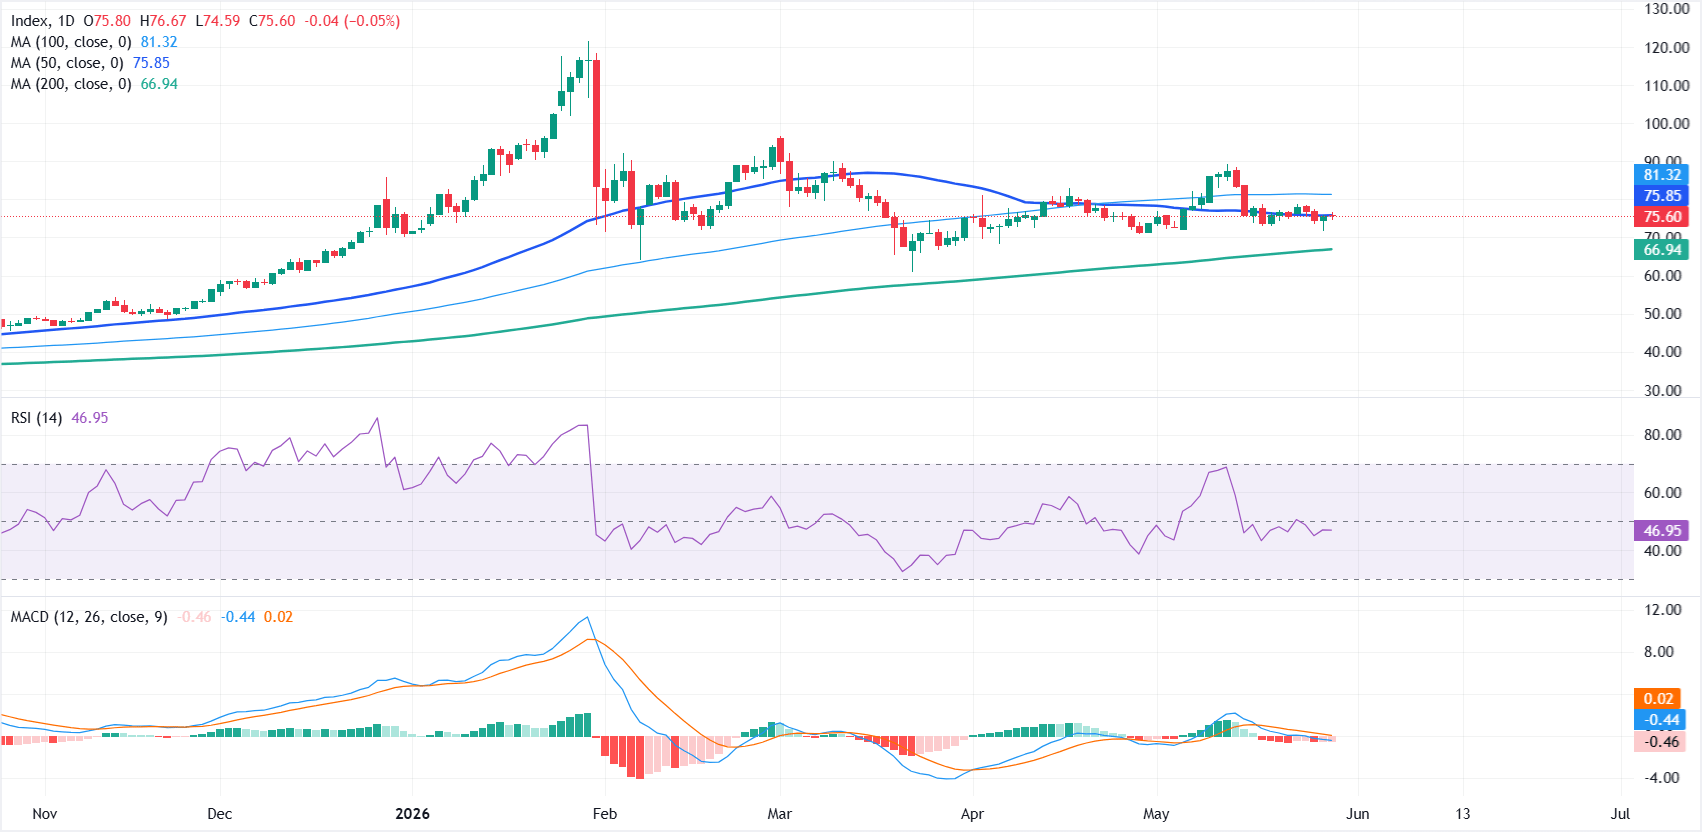
On the daily chart, XAG/USD holds below the short-term trend marker as the near-term tone turns mildly bullish. The 50-day simple moving average (SMA) at $75.85 is acting as immediate resistance just overhead, while the 100-day SMA at $81.32 marks a higher cap that reinforces the idea of a market consolidating underneath its medium-term slope.
Momentum studies are soft with the Relative Strength Index (RSI) hovering near 47 and Moving Average Convergence Divergence (MACD) readings below the zero line, which together hint at limited bullish pressure.
On the topside, a daily close above the 50-day SMA at $75.84 would be the first signal that buyers are attempting to regain control, exposing the 100-day SMA at $81.32 as the next notable barrier.
On the downside, the broader bullish structure remains intact while price holds well above the 200-day SMA at $66.94, which offers a key layer of underlying support and a potential zone where medium-term dip buyers could emerge.
(The technical analysis of this story was written with the help of an AI tool.)
Silver FAQs
Silver is a precious metal highly traded among investors. It has been historically used as a store of value and a medium of exchange. Although less popular than Gold, traders may turn to Silver to diversify their investment portfolio, for its intrinsic value or as a potential hedge during high-inflation periods. Investors can buy physical Silver, in coins or in bars, or trade it through vehicles such as Exchange Traded Funds, which track its price on international markets.
Silver prices can move due to a wide range of factors. Geopolitical instability or fears of a deep recession can make Silver price escalate due to its safe-haven status, although to a lesser extent than Gold's. As a yieldless asset, Silver tends to rise with lower interest rates. Its moves also depend on how the US Dollar (USD) behaves as the asset is priced in dollars (XAG/USD). A strong Dollar tends to keep the price of Silver at bay, whereas a weaker Dollar is likely to propel prices up. Other factors such as investment demand, mining supply – Silver is much more abundant than Gold – and recycling rates can also affect prices.
Silver is widely used in industry, particularly in sectors such as electronics or solar energy, as it has one of the highest electric conductivity of all metals – more than Copper and Gold. A surge in demand can increase prices, while a decline tends to lower them. Dynamics in the US, Chinese and Indian economies can also contribute to price swings: for the US and particularly China, their big industrial sectors use Silver in various processes; in India, consumers’ demand for the precious metal for jewellery also plays a key role in setting prices.
Silver prices tend to follow Gold's moves. When Gold prices rise, Silver typically follows suit, as their status as safe-haven assets is similar. The Gold/Silver ratio, which shows the number of ounces of Silver needed to equal the value of one ounce of Gold, may help to determine the relative valuation between both metals. Some investors may consider a high ratio as an indicator that Silver is undervalued, or Gold is overvalued. On the contrary, a low ratio might suggest that Gold is undervalued relative to Silver.
Author

Vishal Chaturvedi
FXStreet
I am a macro-focused research analyst with over four years of experience covering forex and commodities market. I enjoy breaking down complex economic trends and turning them into clear, actionable insights that help traders stay ahead of the curve.

















