Silver Price Forecast: XAG/USD rebounds above $75, higher Treasury yields limit upside
- Silver price bounces back to near $75.20, outlook remains uncertain.
- US short and long-dated Treasury yields surge as traders price out dovish Fed bets.
- Investors await FOMC minutes for fresh cues on the US interest rate outlook.

Silver price (XAG) trades 2% higher to near $75.20 during the European trading session on Wednesday. The white metal recovers from its almost two-week low of $73.10 posted the previous day. However, the outlook of the Silver price remains bearish as United States (US) Treasury Yields remain firm due to expectations that the Federal Reserve (Fed) will hike benchmark lending rates this year.
10-Year US bond yields have posted a fresh over-a-year high at 4.69% during the day, while yields on 30-year US Treasuries jumped to 5.2%, the highest level seen beyond the sub-prime crisis.
Theoretically, higher yields on interest-bearing assets diminish demand for non-yielding assets, such as Silver.
The CME FedWatch tool shows that the odds of the Fed delivering at least one interest rate hike this year are 56.3%, a sharp turnaround from two interest rate cuts anticipated before the war started in the Middle East.
Dovish Fed bets have squeezed as US inflationary pressures have accelerated due to elevated oil prices. The US Consumer Price Index (CPI) data showed last week that the headline inflation accelerated to 3.8% Year-on-Year (YoY), the highest level seen in almost three years.
Higher US Treasury yields have also strengthened the US Dollar (USD). In the European trade, the US Dollar Index (DXY), which tracks the Greenback’s value against six major currencies, posts a fresh six-week high at 99.47.
Theoretically, a higher US Dollar makes the Silver price an unfavorable risk-reward bet for investors.
For more cues on the United States interest rate outlook, investors await Federal Open Market Committee (FOMC) minutes of the April policy meeting, which will be published at 18:00 GMT.
Silver technical analysis
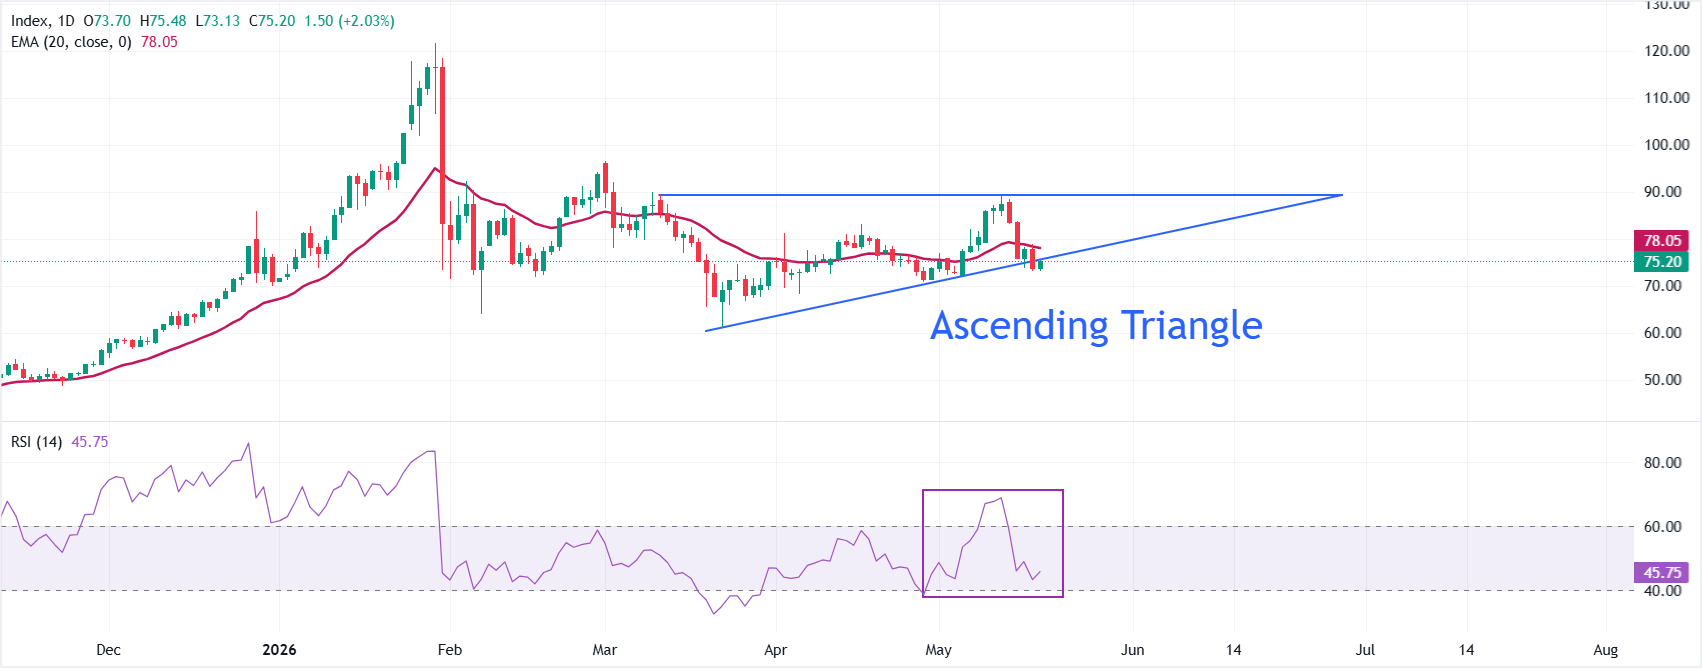
XAG/USD trades higher at around $75.20; however, the near-term tone remains bearish, as it holds below the 20-day Exponential Moving Average (EMA) at around $78.05.
The Relative Strength Index (RSI) at about 46 hovers below the midline, hinting at subdued bullish momentum and reinforcing the idea that bounces are likely to face selling pressure into nearby overhead levels.
The white metal is at a make-or-break point near the upward-sloping border of the Ascending Triangle formation near $75.20. Fresh downside looks likely towards $70.00 if the Silver price fails to hold above its almost two-week low of $73.10. Looking up, the 20-day EMA will act as dynamic barrier; and a break above that is needed to ease downside pressure.
(The technical analysis of this story was written with the help of an AI tool.)
Economic Indicator
FOMC Minutes
FOMC stands for The Federal Open Market Committee that organizes 8 meetings in a year and reviews economic and financial conditions, determines the appropriate stance of monetary policy and assesses the risks to its long-run goals of price stability and sustainable economic growth. FOMC Minutes are released by the Board of Governors of the Federal Reserve and are a clear guide to the future US interest rate policy.
Next release: Wed May 20, 2026 18:00
Frequency: Irregular
Consensus: -
Previous: -
Source: Federal Reserve
Minutes of the Federal Open Market Committee (FOMC) is usually published three weeks after the day of the policy decision. Investors look for clues regarding the policy outlook in this publication alongside the vote split. A bullish tone is likely to provide a boost to the greenback while a dovish stance is seen as USD-negative. It needs to be noted that the market reaction to FOMC Minutes could be delayed as news outlets don’t have access to the publication before the release, unlike the FOMC’s Policy Statement.
Author

Sagar Dua
FXStreet
Sagar Dua is associated with the financial markets from his college days. Along with pursuing post-graduation in Commerce in 2014, he started his markets training with chart analysis.