Silver Price Forecast: XAG/USD rallies above $33.00 as USD slips
- Silver rallies over 1%, clearing $33.00 for the first time since April amid renewed safe-haven demand.
- Technical breakout confirmed, with XAG/USD surpassing the 50-day SMA and a key resistance trendline near $32.75.
- Momentum favors bulls, as RSI trends higher, signaling potential for further gains toward $33.50 and $34.00.
- Downside risk limited to $33.00 support; failure to hold could expose the 100-day SMA at $31.98.

Silver price soared on Tuesday, climbing past the $33.00 mark per troy ounce as the US Dollar weakened across the board. Uncertainty surrounding US trade policies, Moody’s downgrade of US government debt, and the impending increase in the US budget deficit fueled demand for the safe-haven appeal of the gray metal.
XAG/USD Price Forecast: Technical outlook
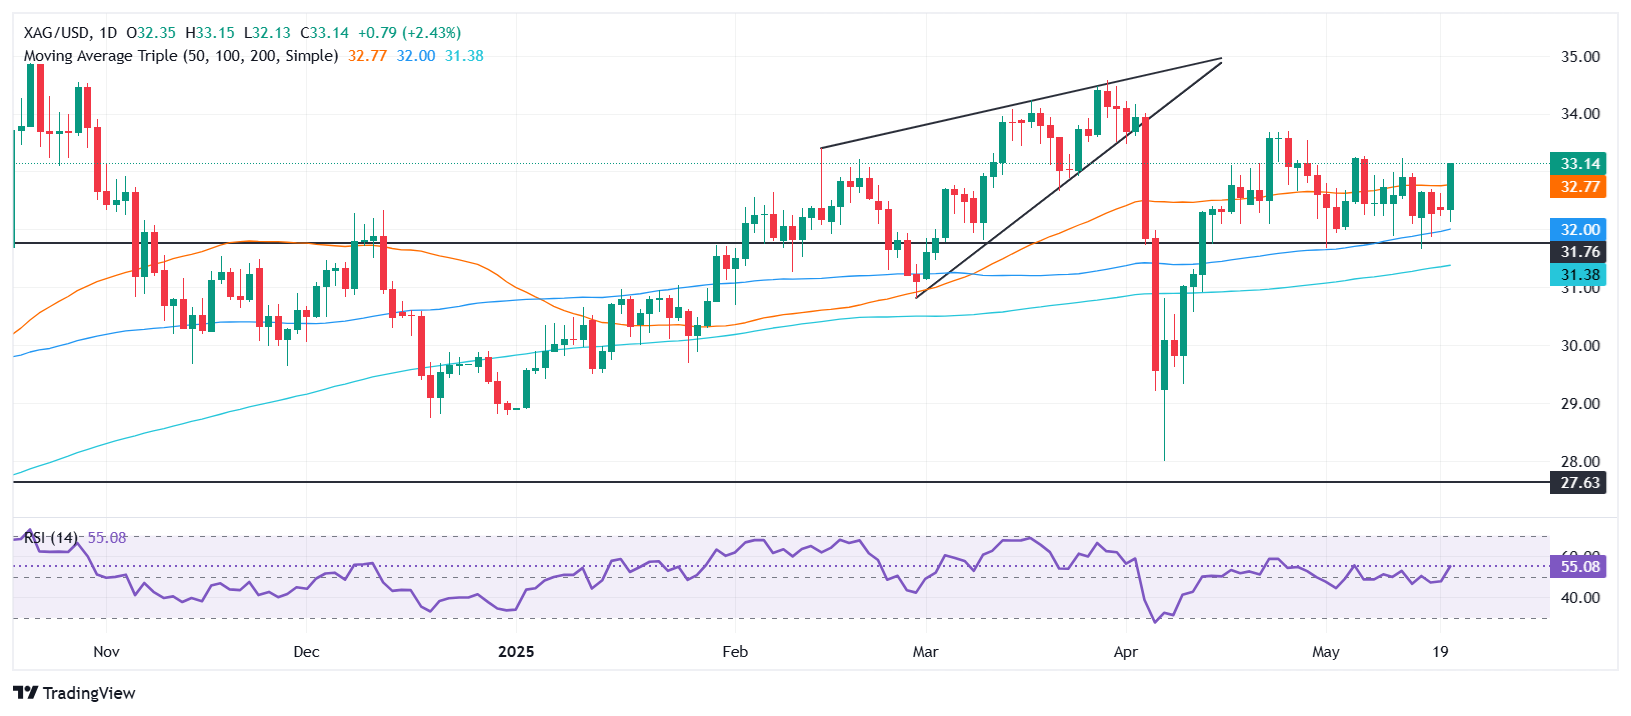
From a technical perspective, Silver trades sideways, though slightly tilted to the upside. Buyers clearing the 50-day Simple Moving Average (SMA) at $32.75 opened the door to surpass the $33.00 mark as they eye a test of the $33.50 figure. It is worth noting that the impulse cleared a resistance trendline drawn from the April and May highs, which were broken at around $32.70/85, confirming the continuation of the trend.
The Relative Strength Index (RSI) favors buyers. Therefore, if the RSI continues to trend higher, it would confirm the continuation of the ongoing upward trend.
On the other hand, Silver’s key support level is $33.00. A break below could send XAG/USD diving towards the 100-day SMA at $31.98, ahead of testing the 200-day SMA at $31.30.
XAG/USD Price Chart – Daily
Silver FAQs
Silver is a precious metal highly traded among investors. It has been historically used as a store of value and a medium of exchange. Although less popular than Gold, traders may turn to Silver to diversify their investment portfolio, for its intrinsic value or as a potential hedge during high-inflation periods. Investors can buy physical Silver, in coins or in bars, or trade it through vehicles such as Exchange Traded Funds, which track its price on international markets.
Silver prices can move due to a wide range of factors. Geopolitical instability or fears of a deep recession can make Silver price escalate due to its safe-haven status, although to a lesser extent than Gold's. As a yieldless asset, Silver tends to rise with lower interest rates. Its moves also depend on how the US Dollar (USD) behaves as the asset is priced in dollars (XAG/USD). A strong Dollar tends to keep the price of Silver at bay, whereas a weaker Dollar is likely to propel prices up. Other factors such as investment demand, mining supply – Silver is much more abundant than Gold – and recycling rates can also affect prices.
Silver is widely used in industry, particularly in sectors such as electronics or solar energy, as it has one of the highest electric conductivity of all metals – more than Copper and Gold. A surge in demand can increase prices, while a decline tends to lower them. Dynamics in the US, Chinese and Indian economies can also contribute to price swings: for the US and particularly China, their big industrial sectors use Silver in various processes; in India, consumers’ demand for the precious metal for jewellery also plays a key role in setting prices.
Silver prices tend to follow Gold's moves. When Gold prices rise, Silver typically follows suit, as their status as safe-haven assets is similar. The Gold/Silver ratio, which shows the number of ounces of Silver needed to equal the value of one ounce of Gold, may help to determine the relative valuation between both metals. Some investors may consider a high ratio as an indicator that Silver is undervalued, or Gold is overvalued. On the contrary, a low ratio might suggest that Gold is undervalued relative to Silver.
Author

Christian Borjon Valencia
FXStreet
Markets analyst, news editor, and trading instructor with over 14 years of experience across FX, commodities, US equity indices, and global macro markets.


