Silver Price Forecast: XAG/USD jumps above $33.50 amid looming Trump tariff
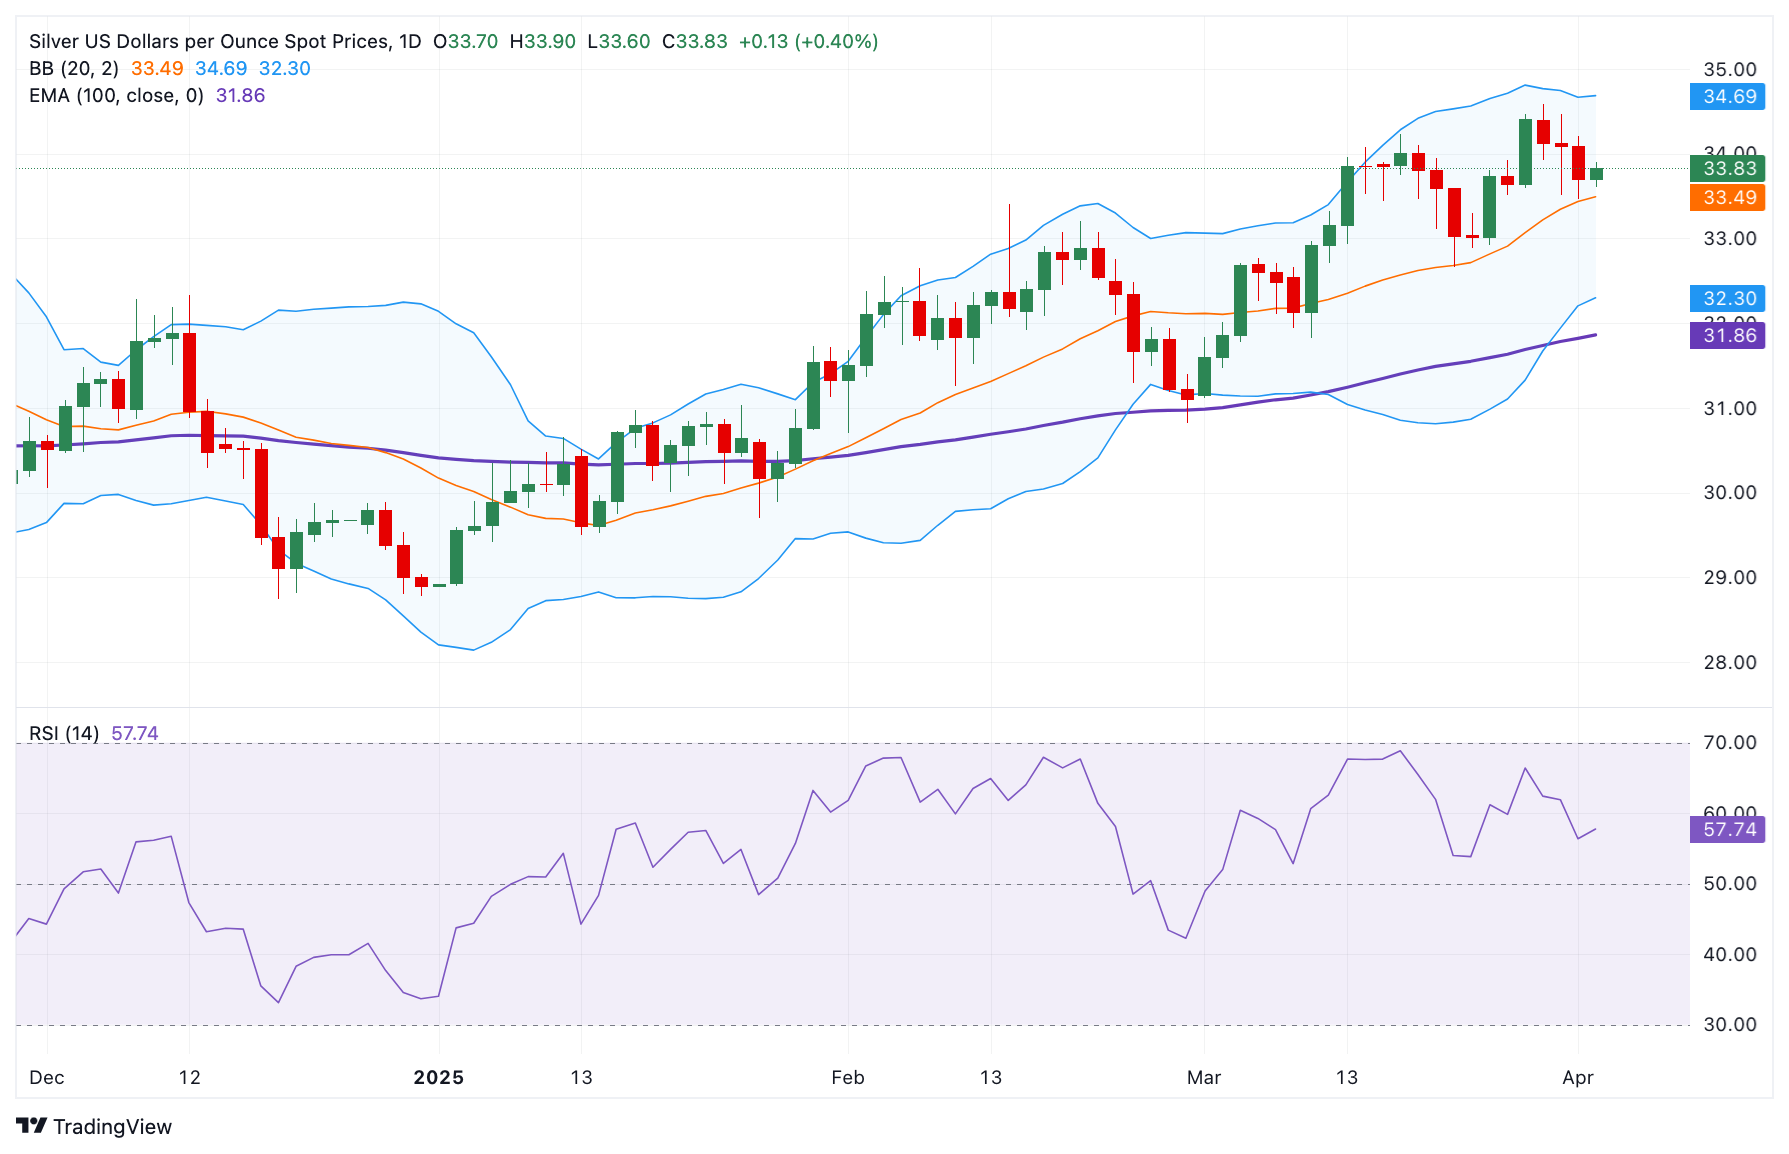
- Silver price gains momentum to near $33.85 in Wednesday’s Asian session.
- The positive view of Silver prevails above the key 100-day EMA with the bullish RSI indicator.
- The immediate resistance level emerges at $34.23; the first support level to watch is $32.92.

The Silver price (XAG/USD) attracts some buyers to around $33.85 during the early European session on Wednesday. The concerns over US President Donald Trump's tariff plans widening the global trade war and triggering an economic slowdown boost the safe-haven flows, supporting the Silver price. Investors brace for US President Donald Trump’s announcement of reciprocal tariffs later on Wednesday.
Technically, the bullish trend of Silver remains in play as the commodity is well-supported above the key 100-day Exponential Moving Average (EMA) on the daily chart. The upward momentum is reinforced by the 14-day Relative Strength Index (RSI), which stands above the midline near 57.80, displaying bullish momentum in the near term.
The first upside target for white metal emerges at $34.23, the high of March 18. Extended gains could see a rally to the $34.60-$34.70 zone, representing the high of March 28 and the upper boundary of the Bollinger Band. The additional upside filter to watch is the $35.00 psychological level.
On the other hand, the first downside target for the silver price is seen at $32.92, the low of March 25. Sustained trading below the mentioned level could see a drop to the next contention level at $31.86, the 100-day EMA. Any follow-through selling could expose $30.82, the low of February 28.
Silver price (XAG/USD) Daily Chart
Silver FAQs
Silver is a precious metal highly traded among investors. It has been historically used as a store of value and a medium of exchange. Although less popular than Gold, traders may turn to Silver to diversify their investment portfolio, for its intrinsic value or as a potential hedge during high-inflation periods. Investors can buy physical Silver, in coins or in bars, or trade it through vehicles such as Exchange Traded Funds, which track its price on international markets.
Silver prices can move due to a wide range of factors. Geopolitical instability or fears of a deep recession can make Silver price escalate due to its safe-haven status, although to a lesser extent than Gold's. As a yieldless asset, Silver tends to rise with lower interest rates. Its moves also depend on how the US Dollar (USD) behaves as the asset is priced in dollars (XAG/USD). A strong Dollar tends to keep the price of Silver at bay, whereas a weaker Dollar is likely to propel prices up. Other factors such as investment demand, mining supply – Silver is much more abundant than Gold – and recycling rates can also affect prices.
Silver is widely used in industry, particularly in sectors such as electronics or solar energy, as it has one of the highest electric conductivity of all metals – more than Copper and Gold. A surge in demand can increase prices, while a decline tends to lower them. Dynamics in the US, Chinese and Indian economies can also contribute to price swings: for the US and particularly China, their big industrial sectors use Silver in various processes; in India, consumers’ demand for the precious metal for jewellery also plays a key role in setting prices.
Silver prices tend to follow Gold's moves. When Gold prices rise, Silver typically follows suit, as their status as safe-haven assets is similar. The Gold/Silver ratio, which shows the number of ounces of Silver needed to equal the value of one ounce of Gold, may help to determine the relative valuation between both metals. Some investors may consider a high ratio as an indicator that Silver is undervalued, or Gold is overvalued. On the contrary, a low ratio might suggest that Gold is undervalued relative to Silver.
BRANDED CONTENT
Choosing a broker that aligns with your trading needs can significantly impact performance. Our list of the best regulated brokers highlights the best options for seamless and cost-effective trading.
Author

Lallalit Srijandorn
FXStreet
Lallalit Srijandorn is a Parisian at heart. She has lived in France since 2019 and now becomes a digital entrepreneur based in Paris and Bangkok.


