Silver Price Forecast: RSI stays in oversold territory as XAG/USD struggles below $60
- Silver steadies after US PCE inflation data eases near-term Fed rate-hike expectations.
- Markets trim September Fed rate-hike bets, but the higher-for-longer policy outlook remains intact.
- Technically, XAG/USD remains under pressure after slipping below $60.00, with prices holding well below the 100-day and 200-day SMAs.

Silver (XAG/USD) steadies on Friday as the US Dollar (USD) and Treasury yields retreat after the latest US Personal Consumption Expenditures (PCE) inflation data showed underlying inflation remained relatively contained.
At the time of writing, XAG/USD trades around $58.12, set to end the month nearly 20% lower after hitting a more than six-month low earlier this week.
Data released on Thursday showed the headline PCE rose 0.4% MoM in May, unchanged from April but below the 0.5% forecast. Core PCE held steady at 0.3%, matching expectations.
The softer monthly inflation readings helped Silver stabilize after the recent sell-off as traders scaled back expectations for a near-term Federal Reserve (Fed) rate hike.
According to the CME FedWatch Tool, markets now price in a 61% probability of a September rate hike, down from 70% a week ago.
However, the white metal lacks strong upside momentum as annual inflation remains well above the Fed's 2% target, reinforcing expectations that monetary policy will remain restrictive for longer. That view was echoed by Chair Kevin Warsh, who stressed the need to restore price stability at this month's policy meeting.
Unless markets meaningfully scale back expectations for Fed rate hikes, Silver's bearish technical outlook is likely to keep upside attempts in check.
Technical Analysis:
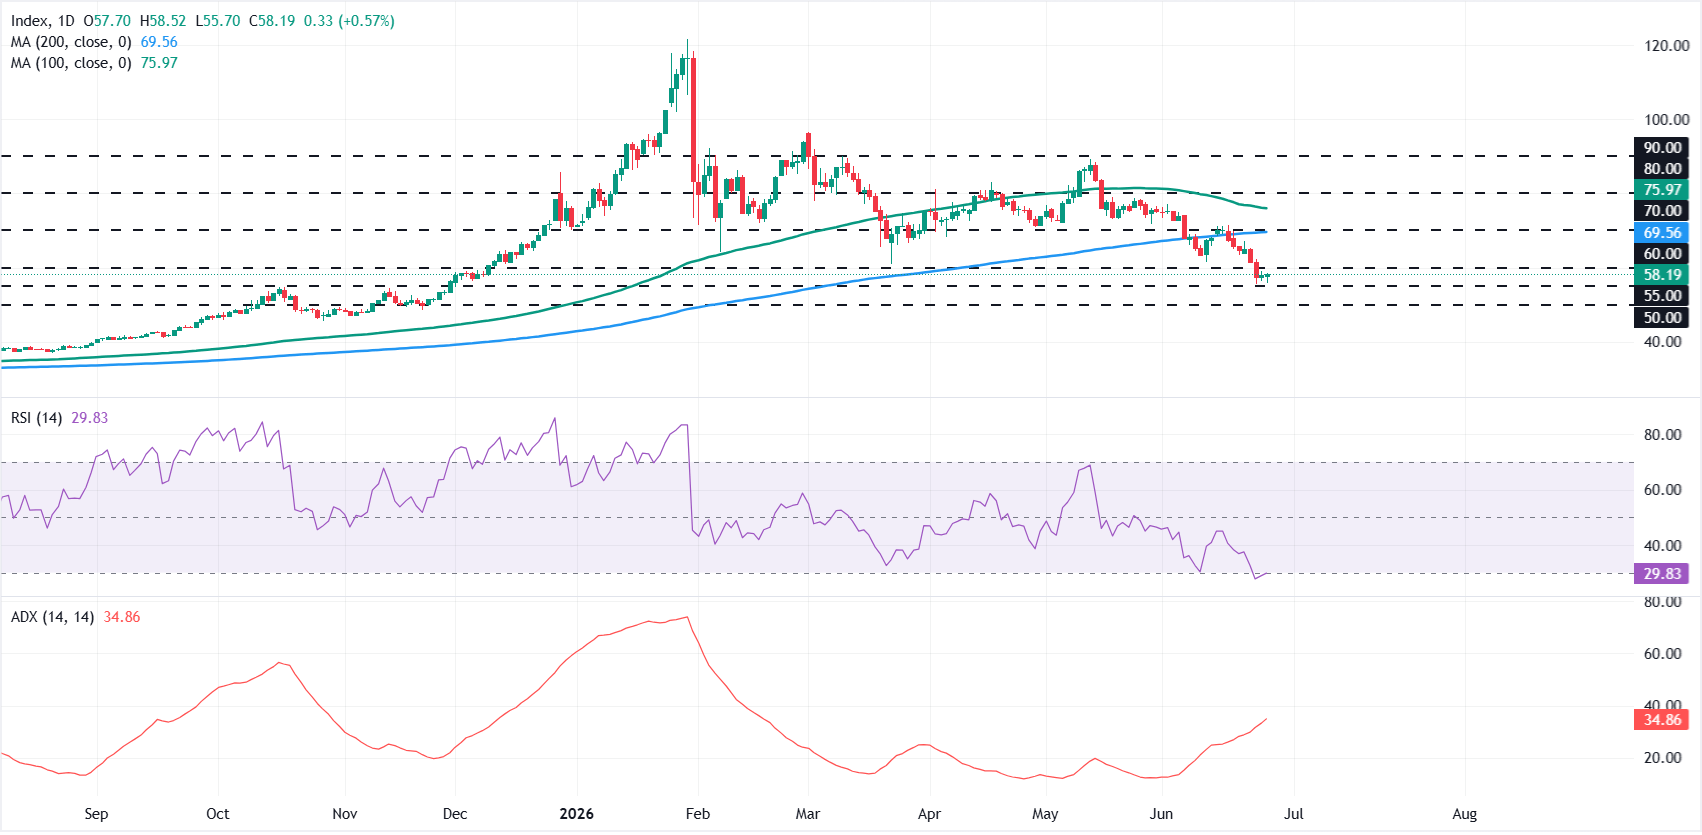
In the daily chart, XAG/USD remains in a bearish phase with price holding below the 100-day Simple Moving Average (SMA) at $75.97 and the 200-day SMA at $69.56.
This alignment of major SMAs above the spot suggests the broader trend remains under downside pressure, while the nearby horizontal barrier at $60.00 adds to the overhead supply.
The Relative Strength Index (RSI) sits in oversold territory near 30, hinting that selling is stretched but not yet decisively reversing, and the Average Directional Index (ADX) above 30 reinforces that the prevailing downtrend retains firmness.
On the downside, immediate support is seen at the horizontal level of $55.00, ahead of a deeper structural floor near $50.00, where buyers could attempt to stabilize the decline.
On the topside, initial resistance is located at $60.00, followed by the 200-day SMA at $69.56 and the $70.00 horizontal cap forming a broader supply zone. Further up, the 100-day SMA at $75.97 and the subsequent barriers at $80.00 and $90.00 define progressively stronger resistance layers that XAG/USD would need to reclaim to ease the current bearish bias.
(The technical analysis of this story was written with the help of an AI tool.)
Silver FAQs
Silver is a precious metal highly traded among investors. It has been historically used as a store of value and a medium of exchange. Although less popular than Gold, traders may turn to Silver to diversify their investment portfolio, for its intrinsic value or as a potential hedge during high-inflation periods. Investors can buy physical Silver, in coins or in bars, or trade it through vehicles such as Exchange Traded Funds, which track its price on international markets.
Silver prices can move due to a wide range of factors. Geopolitical instability or fears of a deep recession can make Silver price escalate due to its safe-haven status, although to a lesser extent than Gold's. As a yieldless asset, Silver tends to rise with lower interest rates. Its moves also depend on how the US Dollar (USD) behaves as the asset is priced in dollars (XAG/USD). A strong Dollar tends to keep the price of Silver at bay, whereas a weaker Dollar is likely to propel prices up. Other factors such as investment demand, mining supply – Silver is much more abundant than Gold – and recycling rates can also affect prices.
Silver is widely used in industry, particularly in sectors such as electronics or solar energy, as it has one of the highest electric conductivity of all metals – more than Copper and Gold. A surge in demand can increase prices, while a decline tends to lower them. Dynamics in the US, Chinese and Indian economies can also contribute to price swings: for the US and particularly China, their big industrial sectors use Silver in various processes; in India, consumers’ demand for the precious metal for jewellery also plays a key role in setting prices.
Silver prices tend to follow Gold's moves. When Gold prices rise, Silver typically follows suit, as their status as safe-haven assets is similar. The Gold/Silver ratio, which shows the number of ounces of Silver needed to equal the value of one ounce of Gold, may help to determine the relative valuation between both metals. Some investors may consider a high ratio as an indicator that Silver is undervalued, or Gold is overvalued. On the contrary, a low ratio might suggest that Gold is undervalued relative to Silver.
Author

Vishal Chaturvedi
FXStreet
I am a macro-focused research analyst with over four years of experience covering forex and commodities market. I enjoy breaking down complex economic trends and turning them into clear, actionable insights that help traders stay ahead of the curve.