Silver Price Analysis: XAG/USD remains depressed below mid-$27.00s, seems vulnerable
- Silver remains under some selling pressure for the second straight day, albeit lacks follow-through.
- The technical setup favors bearish traders and supports prospects for a further depreciating move.
- Any meaningful move up is likely to attract fresh sellers and remain capped near the 100-day SMA.

Silver (XAG/USD) drifts lower for the second straight day on Monday and trades below mid-$27.00s during the Asian session. The white metal, however, remains confined in a broader range held over the past week or so and seems vulnerable to prolonging the recent downward trajectory witnessed over the past month or so.
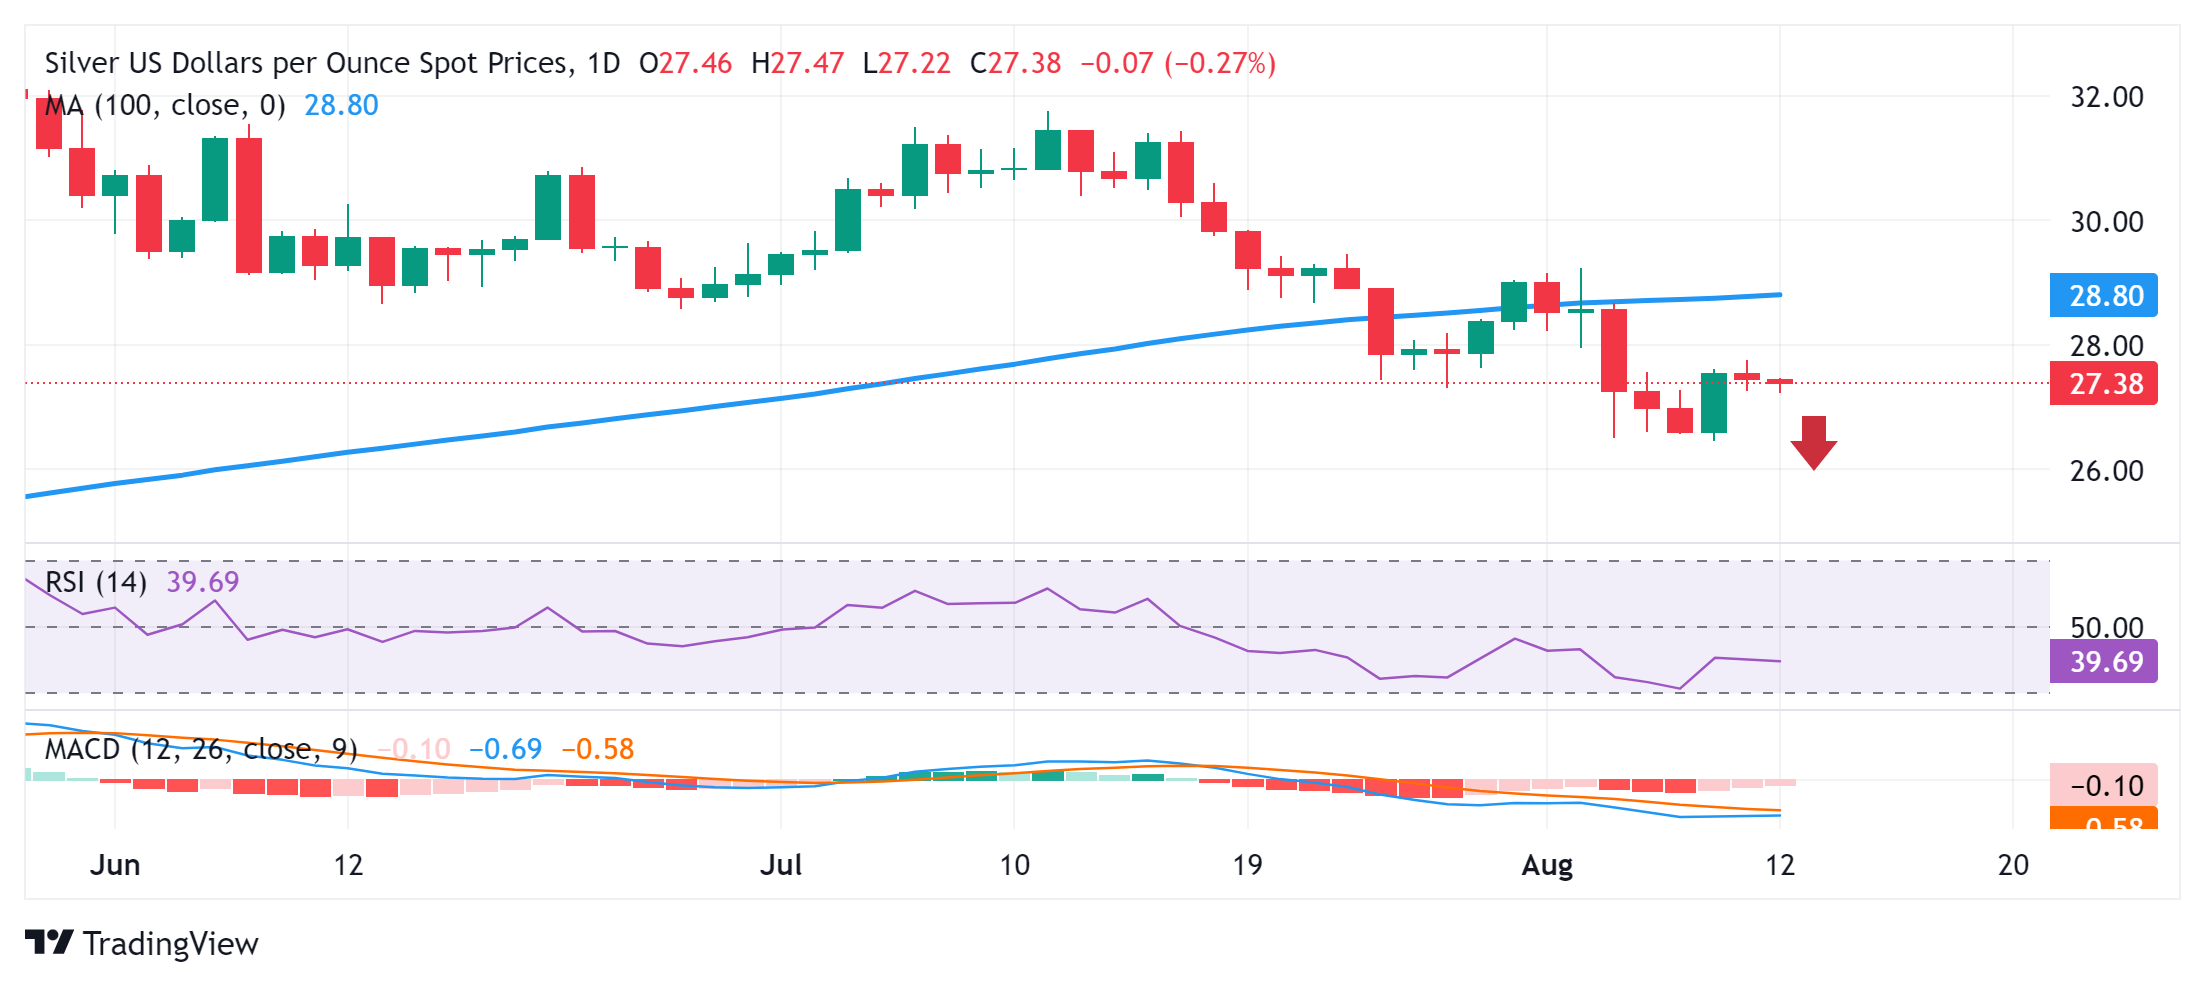
From a technical perspective, Friday's failure near the 23.6% Fibonacci retracement level of the July-August downfall and some follow-through selling validates the near-term negative outlook for the XAG/USD. Moreover, oscillators on the daily chart are holding deep in negative territory and are still away from being in the oversold zone. Hence, a subsequent slide below the $27.00 mark, towards retesting the multi-month low near the $26.50-$26.45 area touched last week, looks like a distinct possibility.
A convincing break below the latter will be seen as a fresh trigger for bearish traders and drag the XAG/USD further towards the May monthly swing low, around the $26.00 mark. The white metal could extend the descending trend and eventually drop to intermediate support near the $25.60 horizontal zone en route to the $25.00 psychological mark.
On the flip side, move beyond 23.6% Fibo. level, around the $27.75 region, might trigger a short-covering rally and pave the way for some meaningful gains. The XAG/USD might then climb beyond the $28.00 round-figure mark, towards the 38.2% Fibo. level around the $28.50-$28.55 region. Any further move up, however, is more likely to attract fresh sellers and remain capped near the 100-day Simple Moving Average (SMA) support breakpoint, currently pegged near the $28.75-$28.80 area.
The latter should act as a key pivotal point, which if cleared decisively might negate the near-term bearish outlook. The XAG/USD might then reclaim the $29.00 mark and appreciate further toward the next relevant hurdle near the $29.45 zone. The recovery momentum could extend further towards the 61.8% Fibo. level, around the $29.75 region, before bullish traders aim to reclaim the $30.00 psychological mark.
Silver daily chart
Silver FAQs
Silver is a precious metal highly traded among investors. It has been historically used as a store of value and a medium of exchange. Although less popular than Gold, traders may turn to Silver to diversify their investment portfolio, for its intrinsic value or as a potential hedge during high-inflation periods. Investors can buy physical Silver, in coins or in bars, or trade it through vehicles such as Exchange Traded Funds, which track its price on international markets.
Silver prices can move due to a wide range of factors. Geopolitical instability or fears of a deep recession can make Silver price escalate due to its safe-haven status, although to a lesser extent than Gold's. As a yieldless asset, Silver tends to rise with lower interest rates. Its moves also depend on how the US Dollar (USD) behaves as the asset is priced in dollars (XAG/USD). A strong Dollar tends to keep the price of Silver at bay, whereas a weaker Dollar is likely to propel prices up. Other factors such as investment demand, mining supply – Silver is much more abundant than Gold – and recycling rates can also affect prices.
Silver is widely used in industry, particularly in sectors such as electronics or solar energy, as it has one of the highest electric conductivity of all metals – more than Copper and Gold. A surge in demand can increase prices, while a decline tends to lower them. Dynamics in the US, Chinese and Indian economies can also contribute to price swings: for the US and particularly China, their big industrial sectors use Silver in various processes; in India, consumers’ demand for the precious metal for jewellery also plays a key role in setting prices.
Silver prices tend to follow Gold's moves. When Gold prices rise, Silver typically follows suit, as their status as safe-haven assets is similar. The Gold/Silver ratio, which shows the number of ounces of Silver needed to equal the value of one ounce of Gold, may help to determine the relative valuation between both metals. Some investors may consider a high ratio as an indicator that Silver is undervalued, or Gold is overvalued. On the contrary, a low ratio might suggest that Gold is undervalued relative to Silver.
Author

Haresh Menghani
FXStreet
Haresh Menghani is a detail-oriented professional with 10+ years of extensive experience in analysing the global financial markets.


