$SIE: Siemens demonstrates impulsive move higher

Siemens SE is a German multinational conglomerate company and by revenue the largest industrial manufacturing enterprise in Europe. Company’s principal business divisions are Industry, Energy, Healthcare, Infrastructure & Cities. Founded in 1847 and headquartered in Munich, Germany, the company employs approx. 385’ooo people worldwide. Siemens is a part of both DAX40 and of SX5E indices. One can note that the economic success of the company is truly accompanied by a strong performance of the Siemens stock.
In the initial article from February 2021, we have forecasted a rally to the new highs. We were right. The price has printed the new all-time highs in January 2022 at 157.96. Then, we saw the stock price pulling back from the all-time highs. In the last article from June 2022, we have expected to take place after doing zigzag lower lower. However, March 2022 lows have broken and the market has decided to do a double correction before turning higher. In the current blog, we analyze the structure of the price movement and provide the targets.
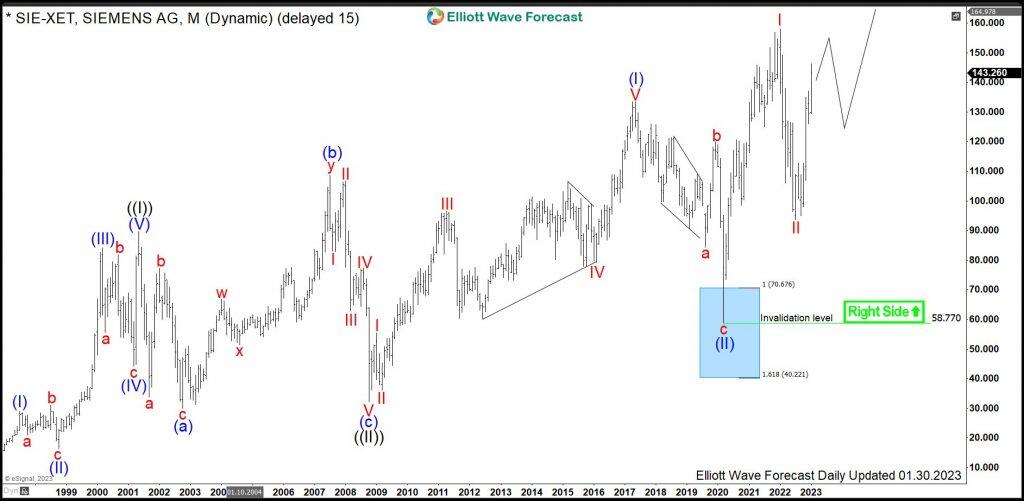
Siemens monthly Elliott Wave analysis 01.30.2023
The monthly chart below shows the Siemens stock $SIE traded at XETRA. From the all-time lows, the stock price has developed a cycle higher in black wave ((I)) of grand super cycle degree towards May 2001 highs at 89.75. From there, a correction lower in black wave ((II)) has unfolded as an Elliott wave expanded flat pattern. It has printed an important bottom on October 2008 at 32.07. From October 2008 lows, a new cycle in wave ((III)) has been already confirmed by breaking above 89.75 highs.
A closer look on the price action from 2008 lows unveils the development of another nest being blue wave (I) of black wave ((III)). The 2008 cycle has reached towards 133.50 on May 2017. From there, a correction has unfolded as a zigzag structure in wave (II). The consolidation has ended in March 2020 at 58.77. While above there, Siemens is already within blue wave (III). Break above the 133.50 high has confirmed that. A target for wave (III) will be 159.95-222.60 area and beyond. Within larger wave (III), one can distinguish already a first nest comprising red waves I and II. While above July 2022 lows, red wave III is in progress.
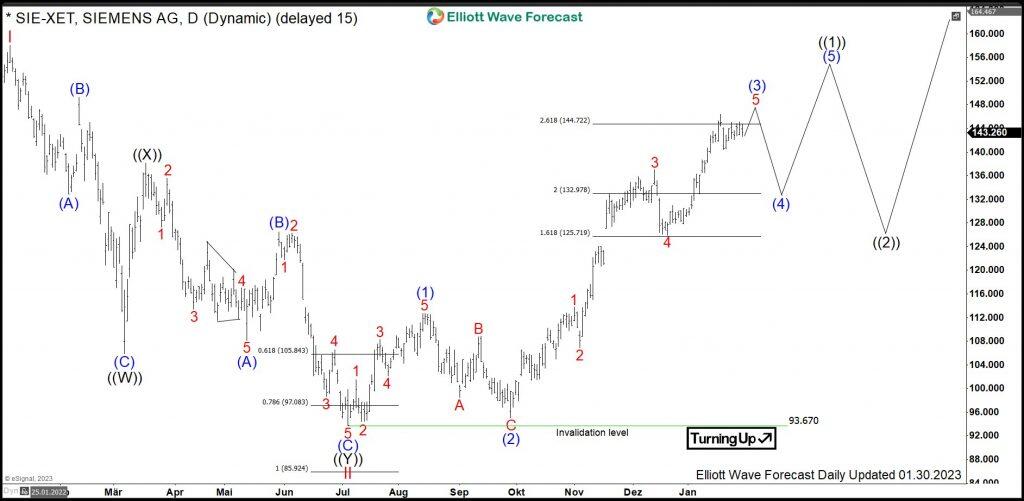
Siemens daily Elliott Wave analysis 01.30.2023
The daily chart below shows in more detail the decline lower from all-time highs in red wave II and first stages of the advance higher in red wave III. After a cycle in red wave I towards January 2022 highs at 157.96, a pullback in wave II shows a double three structure. Firstly, an Elliott wave zigzag lower in black wave ((W)) has printed a medium-term bottom in March 2022 at 111.38 lows. Secondly, a bounce in wave ((X)) has set a connector at 138.08 highs. Finally, another zigzag in black wave ((Y)) has reached towards 93.67 lows in July 2022. It is the preferred view that the correction in red wave II has ended. Now, red wave III is in progress. The target for it will be 192.92- 254.30 area and even higher.
A closer look on the relation between waves ((W)) and ((Y)) within red wave II unveils a truncation. As a matter of fact, the price extension of black wave ((Y)) has reached 0.618-0.786 extension being 105.84-97.08 area but has missed to reach full extension being 85.92-58.77 area. However, RSI divergence has been erased and the rally in the cycle from July 2022 lows has broken the descending channel. Therefore, the correction in wave II is complete. Break above the January 2022 highs will confirm that.
Within red wave III, one can see already 3 swings which give an idea of an impulsive move higher. Firstly, blue wave (1) has set a high at 112.70 in September 2022. Secondly, blue wave (2) has set a short-term bottom at 95.07 lows. Then, swing in blue wave (3) has reached towards 1.618 extension. It has surpassed it confirming being wave (3) of an impulse with an extension in the 3rd wave. Now, wave (3) has reached 2.618x of the wave (1) being 144.72. It can still extend higher. Then, pullback in wave (4) should find support in 3, 7, 11 swings and another leg higher in blue wave (5) should finish the umpulsive move in black wave ((1)). Investors and traders can be looking to buy pullback in black wave ((2)) for an acceleration higher.
Author

Elliott Wave Forecast Team
ElliottWave-Forecast.com

















