Semiconductor Index outlook: Near-term upside limited, broader rally intact

In a recent update on the semiconductor index (SOX), we showed that, based on historical analyses of the relative strength indicator (RSI) returns for the short-, intermediate-, and long-term, the average returns were -7%, +15-25%, and -8 to -26%, respectively. See Table 1 below.
Table 1: Forward returns when the daily RSI5 and 14 are above 95 and 83.5, respectively
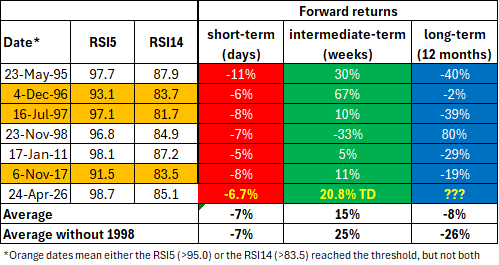
Fast-forward to today, the index lost 6.7% at the April 28 low and has since risen ~21% from the April 26 high. So far, so good. The forward returns remain on track. Moreover, in our previous update, we used our Elliott Wave Principle (EWP) count, see figure 1 below, to show that
“A larger [third wave] is rapidly approaching its end, as its 5th of a 5th wave … is underway. The ideal upside target is based on very extended Fibonacci levels: $12,110 – $12,300. Once reached, the odds of a retrace to about $10,000 increase significantly.”
Figure 1. Daily chart of the SOX with short-term Elliott Wave Count
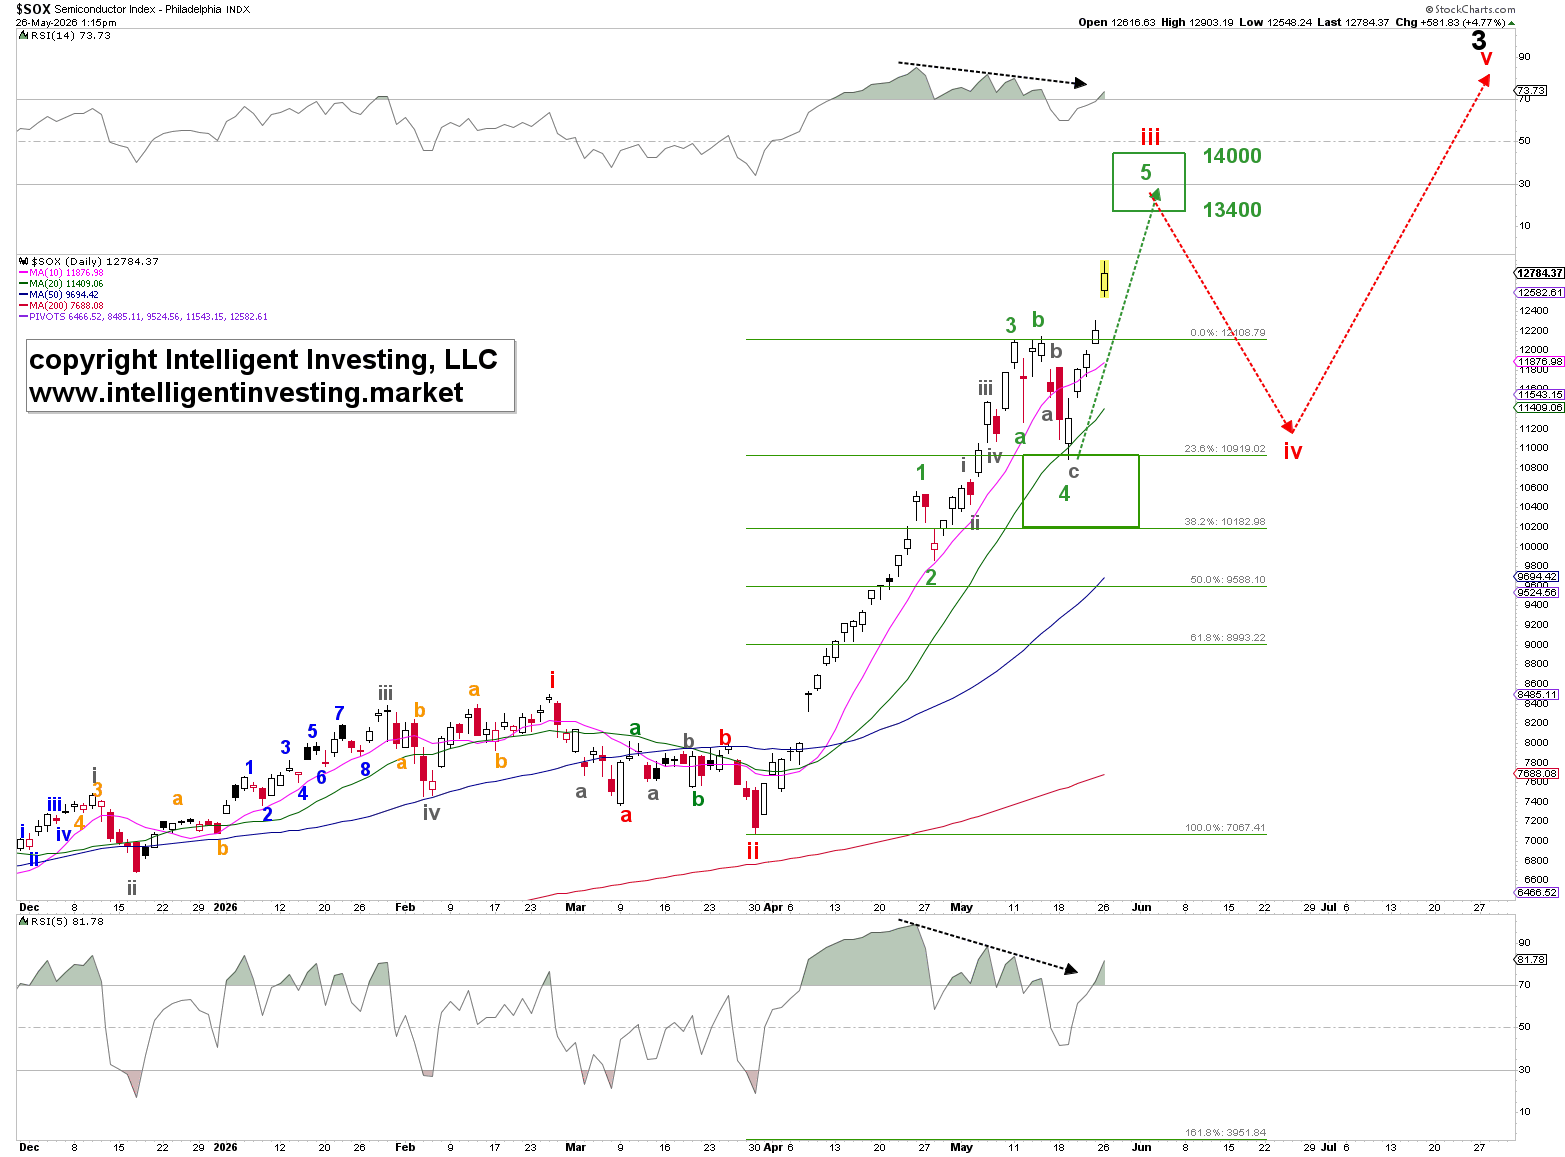
So far, so good. The EWP count remains in line with the index’s price action, having peaked on May 14 at $12,141, right in the ideal target zone. It dropped to $10,895 on May 18, and it is now trading around $12,770. Based on Fibonacci relationships between 1st, 3rd, and 5th waves, we expect the smaller, green 5th Wave (W-5) to reach $13,400-14,000. Thus, the larger (red) W-iii is rapidly approaching its end, as its 5th wave (green W-5) is underway. Once reached, the odds of a retrace (red W-iv) to about $9,600 increase significantly.
Namely, financial markets are inherently stochastic and probabilistic. As a result, rigid, precise market predictions are hard to make consistently. However, the Elliott Wave Principle (EWP) provides a structured framework for understanding price action through recurring, fractal wave patterns driven by collective investor psychology — typically five-wave advances and three-wave corrections. These patterns follow specific rules and guidelines (such as Fibonacci relationships and wave alternation) and unfold across multiple time scales. In this case, as last time, we accurately forecast the SOX's highs and lows using the EWP. Hence, in the right hands, it is a remarkably accurate and reliable tool.
Zooming out, we see that the blue 161.8% extension is approximately $13,462. See Figure 2 below. This is a common 3rd-wave target and coincides with the green W-5 target zone. Once red W-iii completes, we expect a red W-iv, which often targets the (blue) 100.0% extension at around $9,600, followed by a red W-v ideally to $15,000 +/- $1,000.
Figure 2. Monthly chart of the SOX with long-term Elliott Wave Count
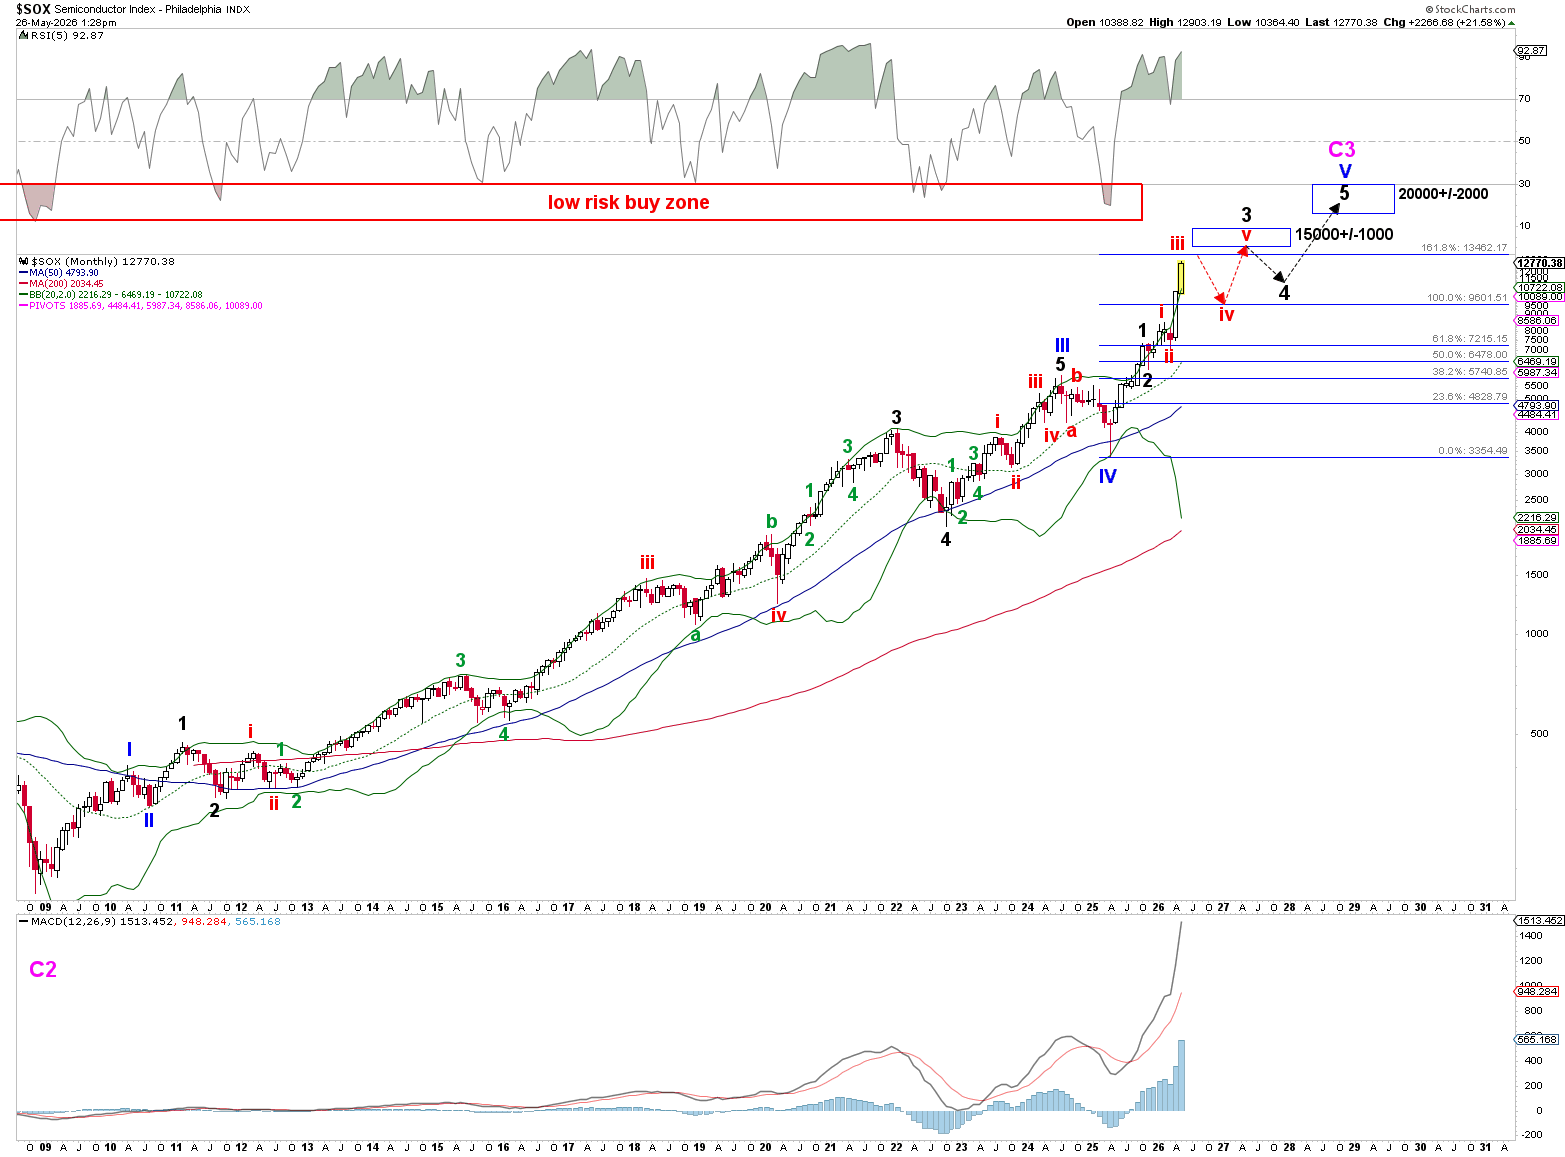
Bottom line: as the index is currently at ~$12,820, short- to intermediate-term upside appears limited, but the rally since the April 2025 low is not yet exhausted.
Author

Dr. Arnout Ter Schure
Intelligent Investing, LLC
After having worked for over ten years within the field of energy and the environment, Dr.
















