|

Russell trading setup explained: Buyers react from the blue box area

In this technical article we’re going to take a look at the Elliott Wave charts charts of RUSSELL Futures $RTY_F published in members area of the website. RUSSELL made a clear 3-wave move down from the 3068 peak and completed the correction right at the Equal Legs zone. In the following text, we will explain the Elliott Wave pattern and the trading setup.

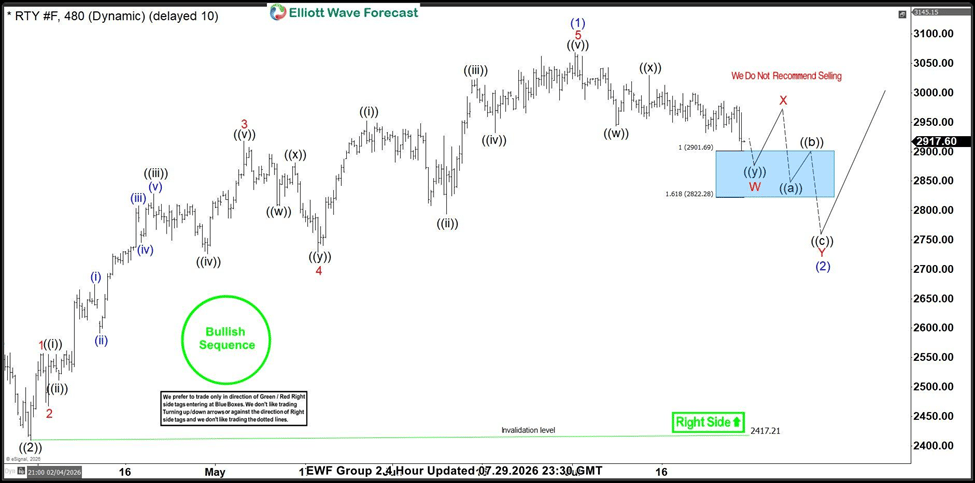
Russell Elliott Wave four-hour chart 07.29.2026

RUSSELL is showing a clear 3-wave correction from the peak. The price is reaching the extreme zone at 2901.69–2822.28. We don’t recommend selling RTY_F and prefer the long side from the marked Blue Box (buying zone).

We expect Russell to ideally make either a rally toward new highs or, alternatively, a 3-wave bounce. Once the bounce reaches 50% Fibonacci retracement against the ((x)) black high, we will make the long position risk-free by moving the stop loss to breakeven and taking partial profits.

The current view suggests that we may only be ending the first leg of the proposed pullback. Regardless, the right side remains the bullish side, and the Blue Box presents a valid trading setup.

Our strategy allows us to enter trades from the current area and make them risk-free as soon as the corresponding bounce develops.
Chart

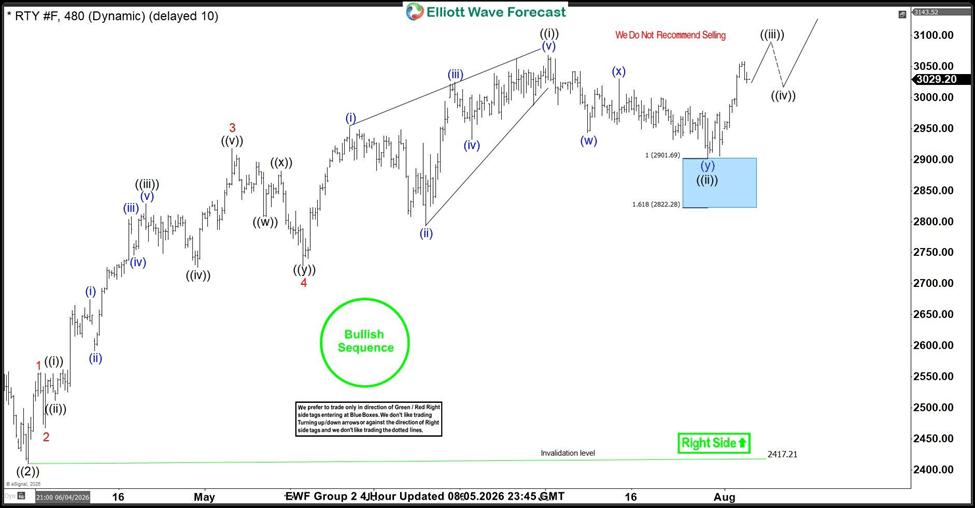
Russell Elliott Wave four-hour chart 07.29.2026

RUSSELL found buyers right at the Equal Legs zone at 2901.69 and produced a very good reaction from the Blue Box Area. Consequently, any long positions taken from the zone should be risk-free by now.

The 3068 level is important at this stage. We would need to see a break above that high to confirm that the next leg is in progress.
Chart

Author

Elliott Wave Forecast Team

Elliott Wave Forecast Team

ElliottWave-Forecast.com

More from Elliott Wave Forecast Team
Share:

Editor's Picks

GBP/USD keeps the bull run intact, still below 1.3500

GBP/USD manages to trade with acceptable gains around 1.3480 on Thursday. Conflicting signals from US and Iranian officials over a potential deal have kept markets cautious and capped Cable’s upside, while investors avoid taking sizeable positions ahead of Friday’s crucial US NFP report.

EUR/USD faces some downside pressure around 1.1540

EUR/USD retreats modestly after advancing for two consecutive days, slipping below 1.1550 on Thursday. In the meantime, markets remain cautious over the prospects of a US-Iran peace agreement and the reopening of the Strait of Hormuz, keeping demand for the safe-haven US Dollar intact and preventing spot from regaining momentum.

How Wall Street rigs the game [Video]

In this week’s Live from the Vault, Andrew Maguire is joined by Peter Antico and Sean Stone to discuss the Paradigm of Money - an in-depth expose of financial market corruption, from naked shorting to the two-tier system that protects Wall Street.

XRP Price Forecast: Sell-off persists, bears aim for $1.00 as Ripple eyes on-chain multi-signature upgrade
Ripple (XRP) remains pressured, trading below $1.05 at the time of writing on Thursday. The token has declined for the fourth consecutive day this week, reflecting lethargic sentiment in the broader cryptocurrency market despite the possibility of easing geopolitical tensions in the Middle East.
The Fed is doing the exact opposite of what it should be doing
About the Yen: The WSJ has a front-page story about how the Fed is doing the exact opposite of what it should be doing—lending dollars to Japan to buy yen. “Put simply: America is printing dollars so Japan can buy yen.
9-3: Is the Federal Reserve’s vote tally Warsh's new forward guidance?
The rate did not move. Neither did the statement, and that’s the more interesting fact. Set the July 29 Federal Open Market Committee (FOMC) statement beside the one issued on June 17, and the two documents are identical apart from a single verb and a paragraph at the bottom naming three dissenters.