|

Rigetti computing RGTI hit another target. Possible extension ahead

RGTI has risen rapidly in value in recent days attracting the attention of investors. Here we have the 15-minute chart. Applying the Elliott Waves principle, the stock should find support in 5.89 – 7.07 area to complete a wave 4. This would generate a new rally on wave 5 that could reach around 8.94 – 10.25 or extend higher.

RGTI 15 Min Chart 12.11.2024

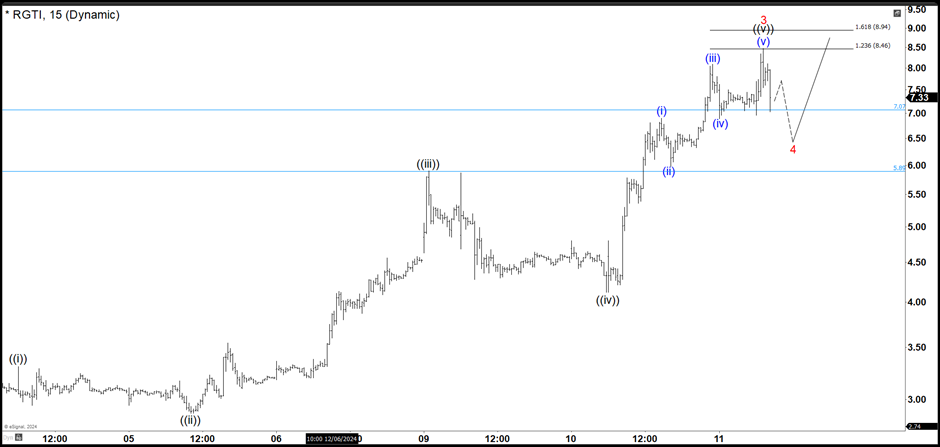
In any case, as long as the market respects the 5.89 – 7.07 area, RGTI must continue with the upward movement and break above wave 3 to reach at least 8.94 – 10.25. If the market closes below 5.89, it would open the possibility that the value of the stock will drop to 4.00 before looking for another move higher.

RGTI 5 Min Chart 12.11.2024 (Market Closed)

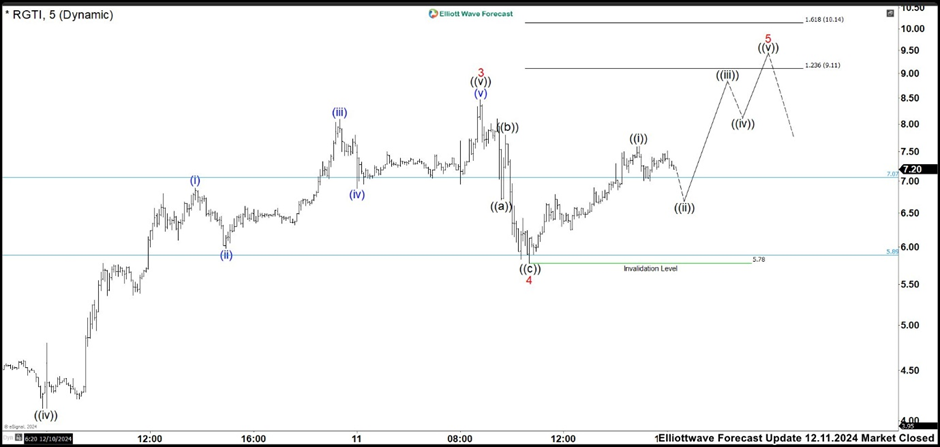
RGTI found support at 5.78 low and rallied. From here, we are looking to build an impulse structure as wave 5. Wave ((i)) could be completed already and while the pullback as wave ((ii)) is above 5.78 low, RGTI should continue higher. The target for this wave 5 comes in 9.11 -10.14 if there is not more extension in the rally.

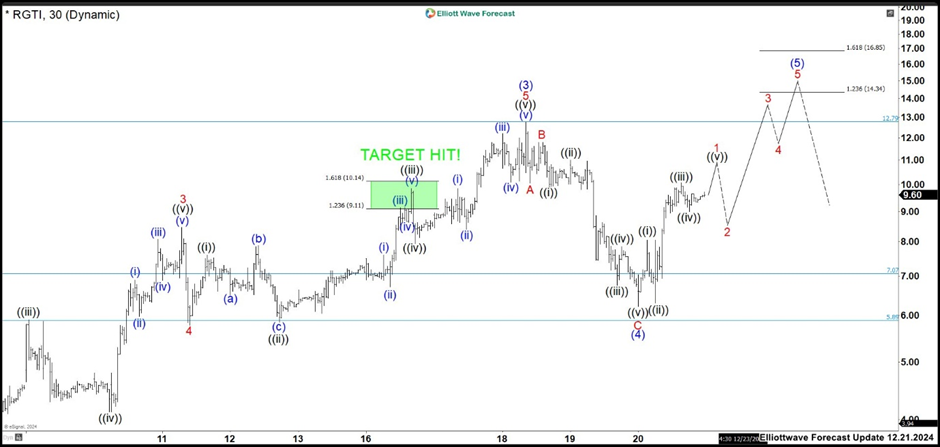
RGTI 30 Min Chart 12.20.2024 

Author

Elliott Wave Forecast Team

Elliott Wave Forecast Team

ElliottWave-Forecast.com

More from Elliott Wave Forecast Team
Share:

Markets move fast. We move first.

Orange Juice Newsletter brings you expert driven insights - not headlines. Every day on your inbox.

By subscribing you agree to our Terms and conditions.

Editor's Picks

EUR/USD climbs toward 1.1800 on broad USD weakness

EUR/USD gathers bullish momentum and advances toward 1.1800 in the second half of the day on Tuesday. The US Dollar weakens and helps the pair stretch higher after the employment report showed that Nonfarm Payrolls declined by 105,000 in October before rising by 64,000 in November.

GBP/USD gains ground above 1.3400 on UK PMI optimism

The GBP/USD pair gains momentum to around 1.3425 during the early Asian session on Wednesday. The Pound Sterling edges higher against the Greenback on the upbeat UK preliminary S&P Global Purchasing Managers' Index data. Traders will take more cues from the Fedspeak later on Wednesday. 

Gold extends the range play around $4,300

Gold edges higher during the Asian session on Wednesday, though it remains confined in a multi-day-old trading range. Dovish Fed-inspired bearish sentiment surrounding the US Dollar, along with the risk-off mood, acts as a tailwind for the safe-haven bullion. However, hopes for a Russia-Ukraine peace deal hold back the XAU/USD bulls from placing aggressive bets. Traders also seem reluctant ahead of the crucial US consumer inflation figures on Thursday.

XRP dips as bearish pressure persists despite ETF growth

Ripple is finding footing above $1.90 at the time of writing on Tuesday after a bearish wave swept across the broader cryptocurrency market, building on persistent negative sentiment.

Ukraine-Russia in the spotlight once again

Since the start of the week, gold’s price has moved lower, but has yet to erase the gains made last week. In today’s report we intend to focus on the newest round of peace talks between Russia and Ukraine, whilst noting the release of the US Employment data later on day and end our report with an update in regards to the tensions brewing in Venezuela.

BNB Price Forecast: BNB slips below $855 as bearish on-chain signals and momentum indicators turn negative

BNB, formerly known as Binance Coin, continues to trade down around $855 at the time of writing on Tuesday, after a slight decline the previous day. Bearish sentiment further strengthens as BNB’s on-chain and derivatives data show rising retail activity.