PNC Financial Services NYSE (PNC) is an American bank holding company and financial services corporation based in Pittsburgh, Pennsylvania. The stock is currently down 45% form all time highs. Investors are looking for clues into the current decline to prepare a plan for the next move. We’ll use the Elliott Wave Theory to define the technical structure and understand the potential path.
PNC monthly Elliott Wave chart
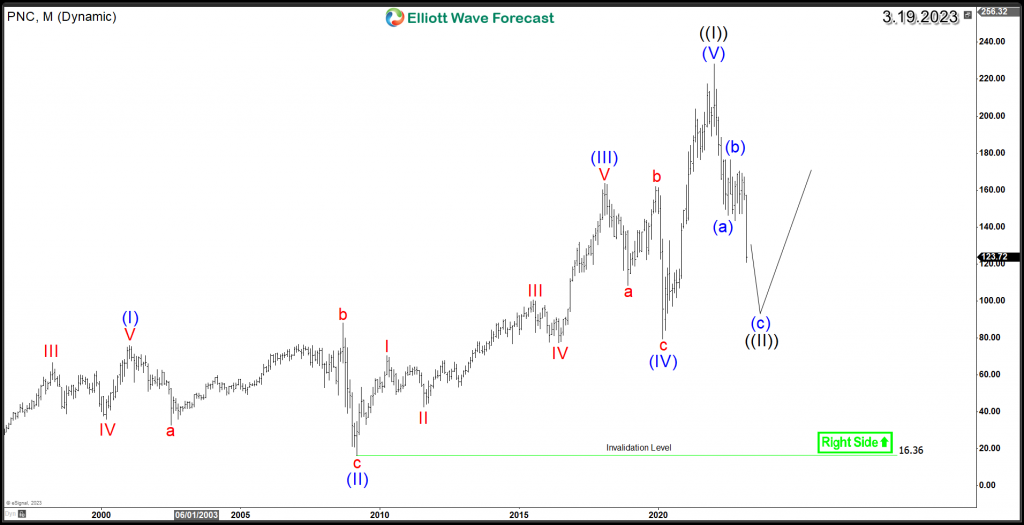
The above chart is showing the entire rally for PNC which ended last year after an impulsive 5 wave advance in wave ((I)). The stock started correcting the entire cycle with an initial 3 waves decline in wave ((II)). Correction unfold in 3 , 7 or 11 swings then the instrument is expected to either resume the rally or at least react in favor of the main trend. Investors will be looking for a potential opportunity at the end of wave ((II)), therefore they need to identify the structure of the decline.
PNC weekly Elliott Wave chart
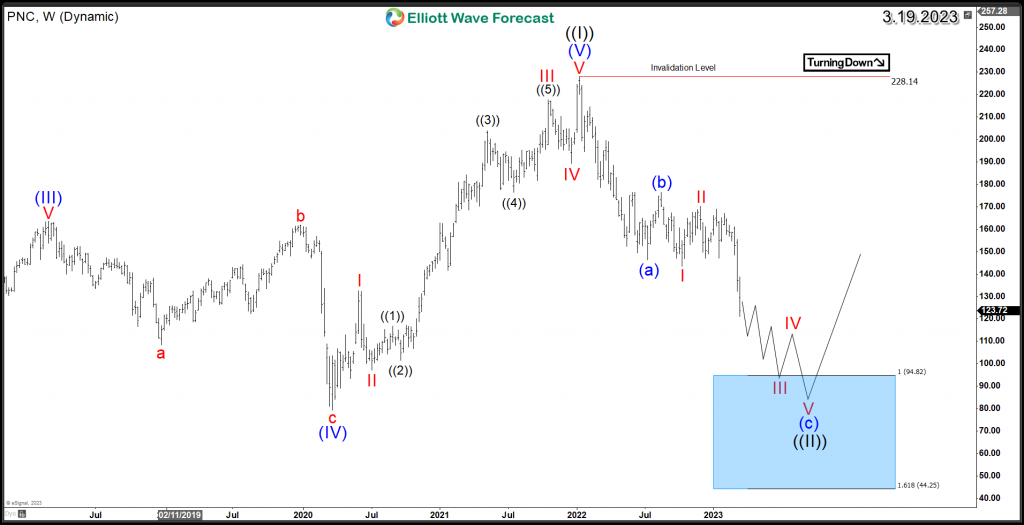
The decline since January 2022 peak is unfolding as a Zigzag Structure. PNC already created a bearish sequence since last year. The continuation took place recently after taking 10/10/2022 low. Wave (a) ended at 146.3 followed by wave (b) bounce at 176.3 and currently wave (c) taking place with an ideal target at equal legs area 94.8 – 44.2 as showing in the weekly chart. The blue boxes in our charts are the High-frequency areas where the Markets are likely to end cycles and make a turn. Therefore that area will provide significant support for PNC, as buyers and investors are expected to take positions and prepare for the next long term move.
FURTHER DISCLOSURES AND DISCLAIMER CONCERNING RISK, RESPONSIBILITY AND LIABILITY Trading in the Foreign Exchange market is a challenging opportunity where above average returns are available for educated and experienced investors who are willing to take above average risk. However, before deciding to participate in Foreign Exchange (FX) trading, you should carefully consider your investment objectives, level of xperience and risk appetite. Do not invest or trade capital you cannot afford to lose. EME PROCESSING AND CONSULTING, LLC, THEIR REPRESENTATIVES, AND ANYONE WORKING FOR OR WITHIN WWW.ELLIOTTWAVE- FORECAST.COM is not responsible for any loss from any form of distributed advice, signal, analysis, or content. Again, we fully DISCLOSE to the Subscriber base that the Service as a whole, the individual Parties, Representatives, or owners shall not be liable to any and all Subscribers for any losses or damages as a result of any action taken by the Subscriber from any trade idea or signal posted on the website(s) distributed through any form of social-media, email, the website, and/or any other electronic, written, verbal, or future form of communication . All analysis, trading signals, trading recommendations, all charts, communicated interpretations of the wave counts, and all content from any media form produced by www.Elliottwave-forecast.com and/or the Representatives are solely the opinions and best efforts of the respective author(s). In general Forex instruments are highly leveraged, and traders can lose some or all of their initial margin funds. All content provided by www.Elliottwave-forecast.com is expressed in good faith and is intended to help Subscribers succeed in the marketplace, but it is never guaranteed. There is no “holy grail” to trading or forecasting the market and we are wrong sometimes like everyone else. Please understand and accept the risk involved when making any trading and/or investment decision. UNDERSTAND that all the content we provide is protected through copyright of EME PROCESSING AND CONSULTING, LLC. It is illegal to disseminate in any form of communication any part or all of our proprietary information without specific authorization. UNDERSTAND that you also agree to not allow persons that are not PAID SUBSCRIBERS to view any of the content not released publicly. IF YOU ARE FOUND TO BE IN VIOLATION OF THESE RESTRICTIONS you or your firm (as the Subscriber) will be charged fully with no discount for one year subscription to our Premium Plus Plan at $1,799.88 for EACH person or firm who received any of our content illegally through the respected intermediary’s (Subscriber in violation of terms) channel(s) of communication.
Recommended content
Editors’ Picks
USD/JPY flat-lines below 151.50 after soft Japanese CPI data
USD/JPY stays defensive below 151.50 after the release of a soft Japan's CPI report and mixed Industrial Production and Retail Sales data on Friday. Japanese verbal intervention also weighs on the pair amid the holiday-thinned conditions on Good Friday. US PCE inflation awaited.
AUD/USD buyers lack vigor above 0.6500 amid Good Friday trading lull
AUD/USD is trading listlessly above 0.6500 in the Asian session amid light trading on Good Friday. The Aussie pair shrugs off encouraging comments from China's FX regulator, as price action remains subdued ahead of the US PCE inflation data.
Gold flirts with record highs above $2,230, all eyes on US PCE data
Gold price flirts with record highs around $2,230 during the Asian session on Friday. The uptick of yellow metal is bolstered by the safe-haven flows amidst growing economic concerns and the prospect of interest rate cuts from the US Federal Reserve.
Optimism price could fall as nearly $90 million worth of OP tokens is due flood markets
Optimism volatility has shrunk in the ours leading to the network’s cliff unlock. It joins the likes of dYdX and Sui, which have similar events on their calendars. As token unlocks are often considered bearish catalysts, investors should brace for a reaction after the event.
Will they won’t they cut rates is the question of Q2?
There has been some significant push back from Fed and Bank of England members around the timing of rate cuts, and the Bank of Japan still haven’t physically intervened in the FX market to stem yen weakness although they are threatening to do so.