PM price analysis: Risk-free target met, $215 ahead?

Philip Morris International Inc. (PM) is a leading global tobacco and nicotine company headquartered in Stamford, Connecticut. It manufactures and markets well-known cigarette brands, including Marlboro, and is actively transitioning toward smoke-free products through its “Beyond Nicotine” strategy. PMI’s flagship smoke-free product, IQOS, uses heat-not-burn technology and has gained significant global adoption. Operating in over 180 markets, the company focuses on reducing the health impact of smoking by investing heavily in science-based alternatives and next-generation nicotine delivery systems.
PM long-term overview
In the 29th October update, we explained the long-term view with the weekly Elliott wave chart. From the all-time low of $32 in March 2009, PM’s stock price has surged over 475%, peaking at $186 in June. Since then, it has completed a 3-swing structure. While we anticipate at least a 5-swing chart evolution, the 3rd swing appears incomplete. We’ve identified the first swing, ending at the June 2017 peak, as wave (I). A pullback followed, correcting it in wave (II), which ended at the March 2020 low. From there, wave (III) began. Wave (III) could target $204, 1.618 of (I) from (II), and potentially even higher.
Meanwhile, waves I and II of (III) started and ended at the February 2022 high and September 2022 low, respectively. From September 2022, a strong wave III of (III) emerged, completing at the June 2025 peak, the current all-time high. The pullback from this peak evolved as wave IV. With the rebound since October 2025, it appears wave IV has finished and price now in wave IV. Thus, the long-term chart still indicates a strong, bullish sequence. We favor buying at the extremes of 3, 7, or 11-swing pullbacks, which we typically mark with a blue box on our charts.
PM Elliottwave trade setup (daily chart)- 29th October 2025 update
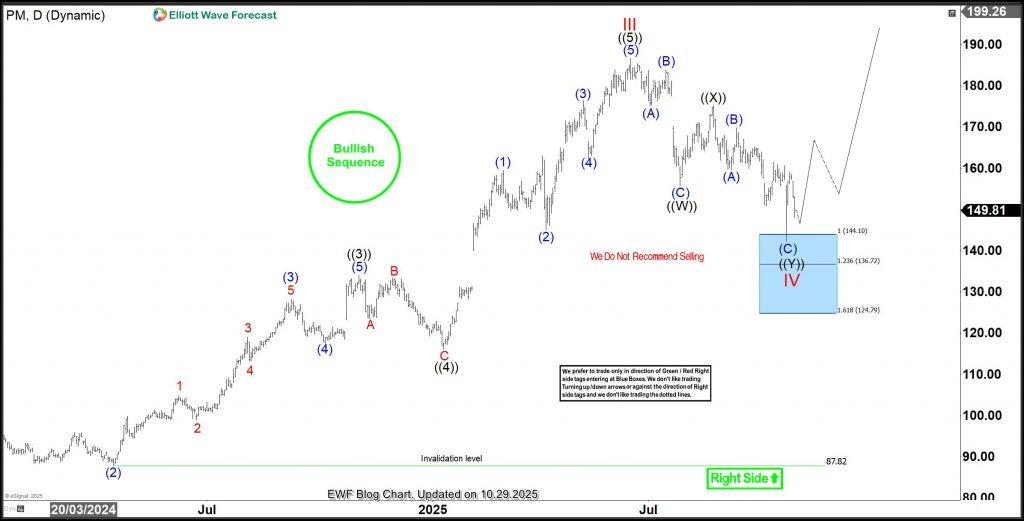
On 29th October, we shared the chart above. The chart shows the blue box zone where we expected wave IV to finish. price reached the blue box and made a swift bounce. From the blue box, we expected at least a 3-swing bounce. However, typically, a 5-wave rally is more probable, to emerge for wave V with target zone at $197-215. Thus, if we were to buy at the blue box, traders could aim for this target zone to book profit. However, we like taking partial profit at 50% of the last leg i.e. wave ((Y)) of IV while adjust rest of the trade to breakeven. This, way we could run a risk-free trade while booking some profit.
PM Elliottwave trade setup (daily chart) - 29th December 2025 update
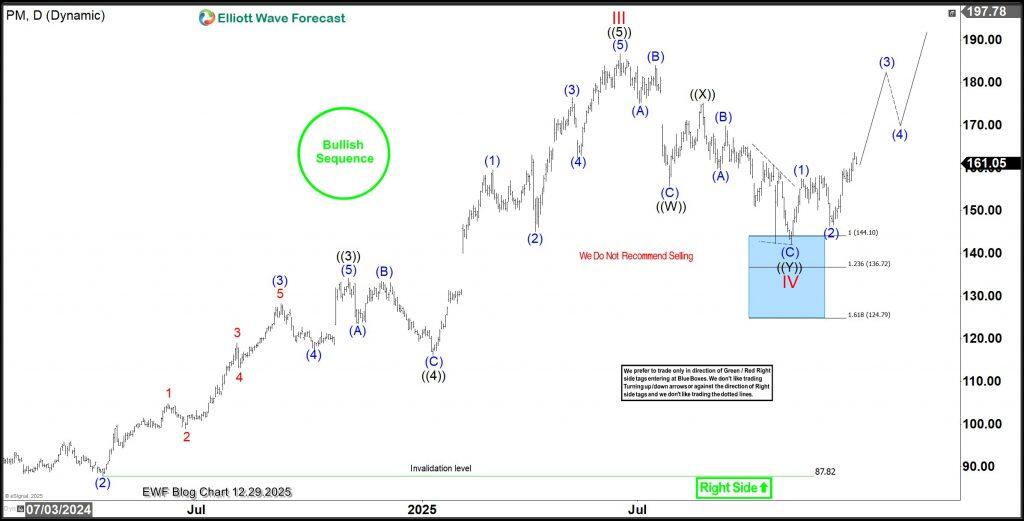
Price did a retest of the blue box and then burst upside as the latest Daily chart above shows. Price appears to have reached the first target at $163.5 and very likely to extends further. Current wave count shows wave (3) of ((1)) of V emerging or price is in wave (1) of ((3)). Either way, this current bullish leg has the potential to reach $180-$200. Overall, the bullish cycle from October low should reach $215 where traders could book final profit on this trade.
Author

Elliott Wave Forecast Team
ElliottWave-Forecast.com


