Warning signs in the stock market: Is this the top, or just a very short fuse?
Overnight, South Korea's Kospi fell more than 10%, SK Hynix lost close to 15% and Samsung Electronics lost 13%. Into that, Dow Jones Industrial Average futures traded up around 1% on paint and soft drinks, and S&P 500 futures sat roughly flat. An index that absorbs a memory-chip panic and prints nothing is not a calm market. It is a market whose calm is a division problem, and the divisor is the only number in equities worth watching this week.
The divisor is correlation, and it is in single digits. That is not a sentiment reading, nor is it a forecast. It is an arithmetic fact about why index protection is cheap while single stocks behave like penny stocks, and it is the reason most of the top-calling toolkit currently points at the wrong thing.
The VIX is not low, it is divided
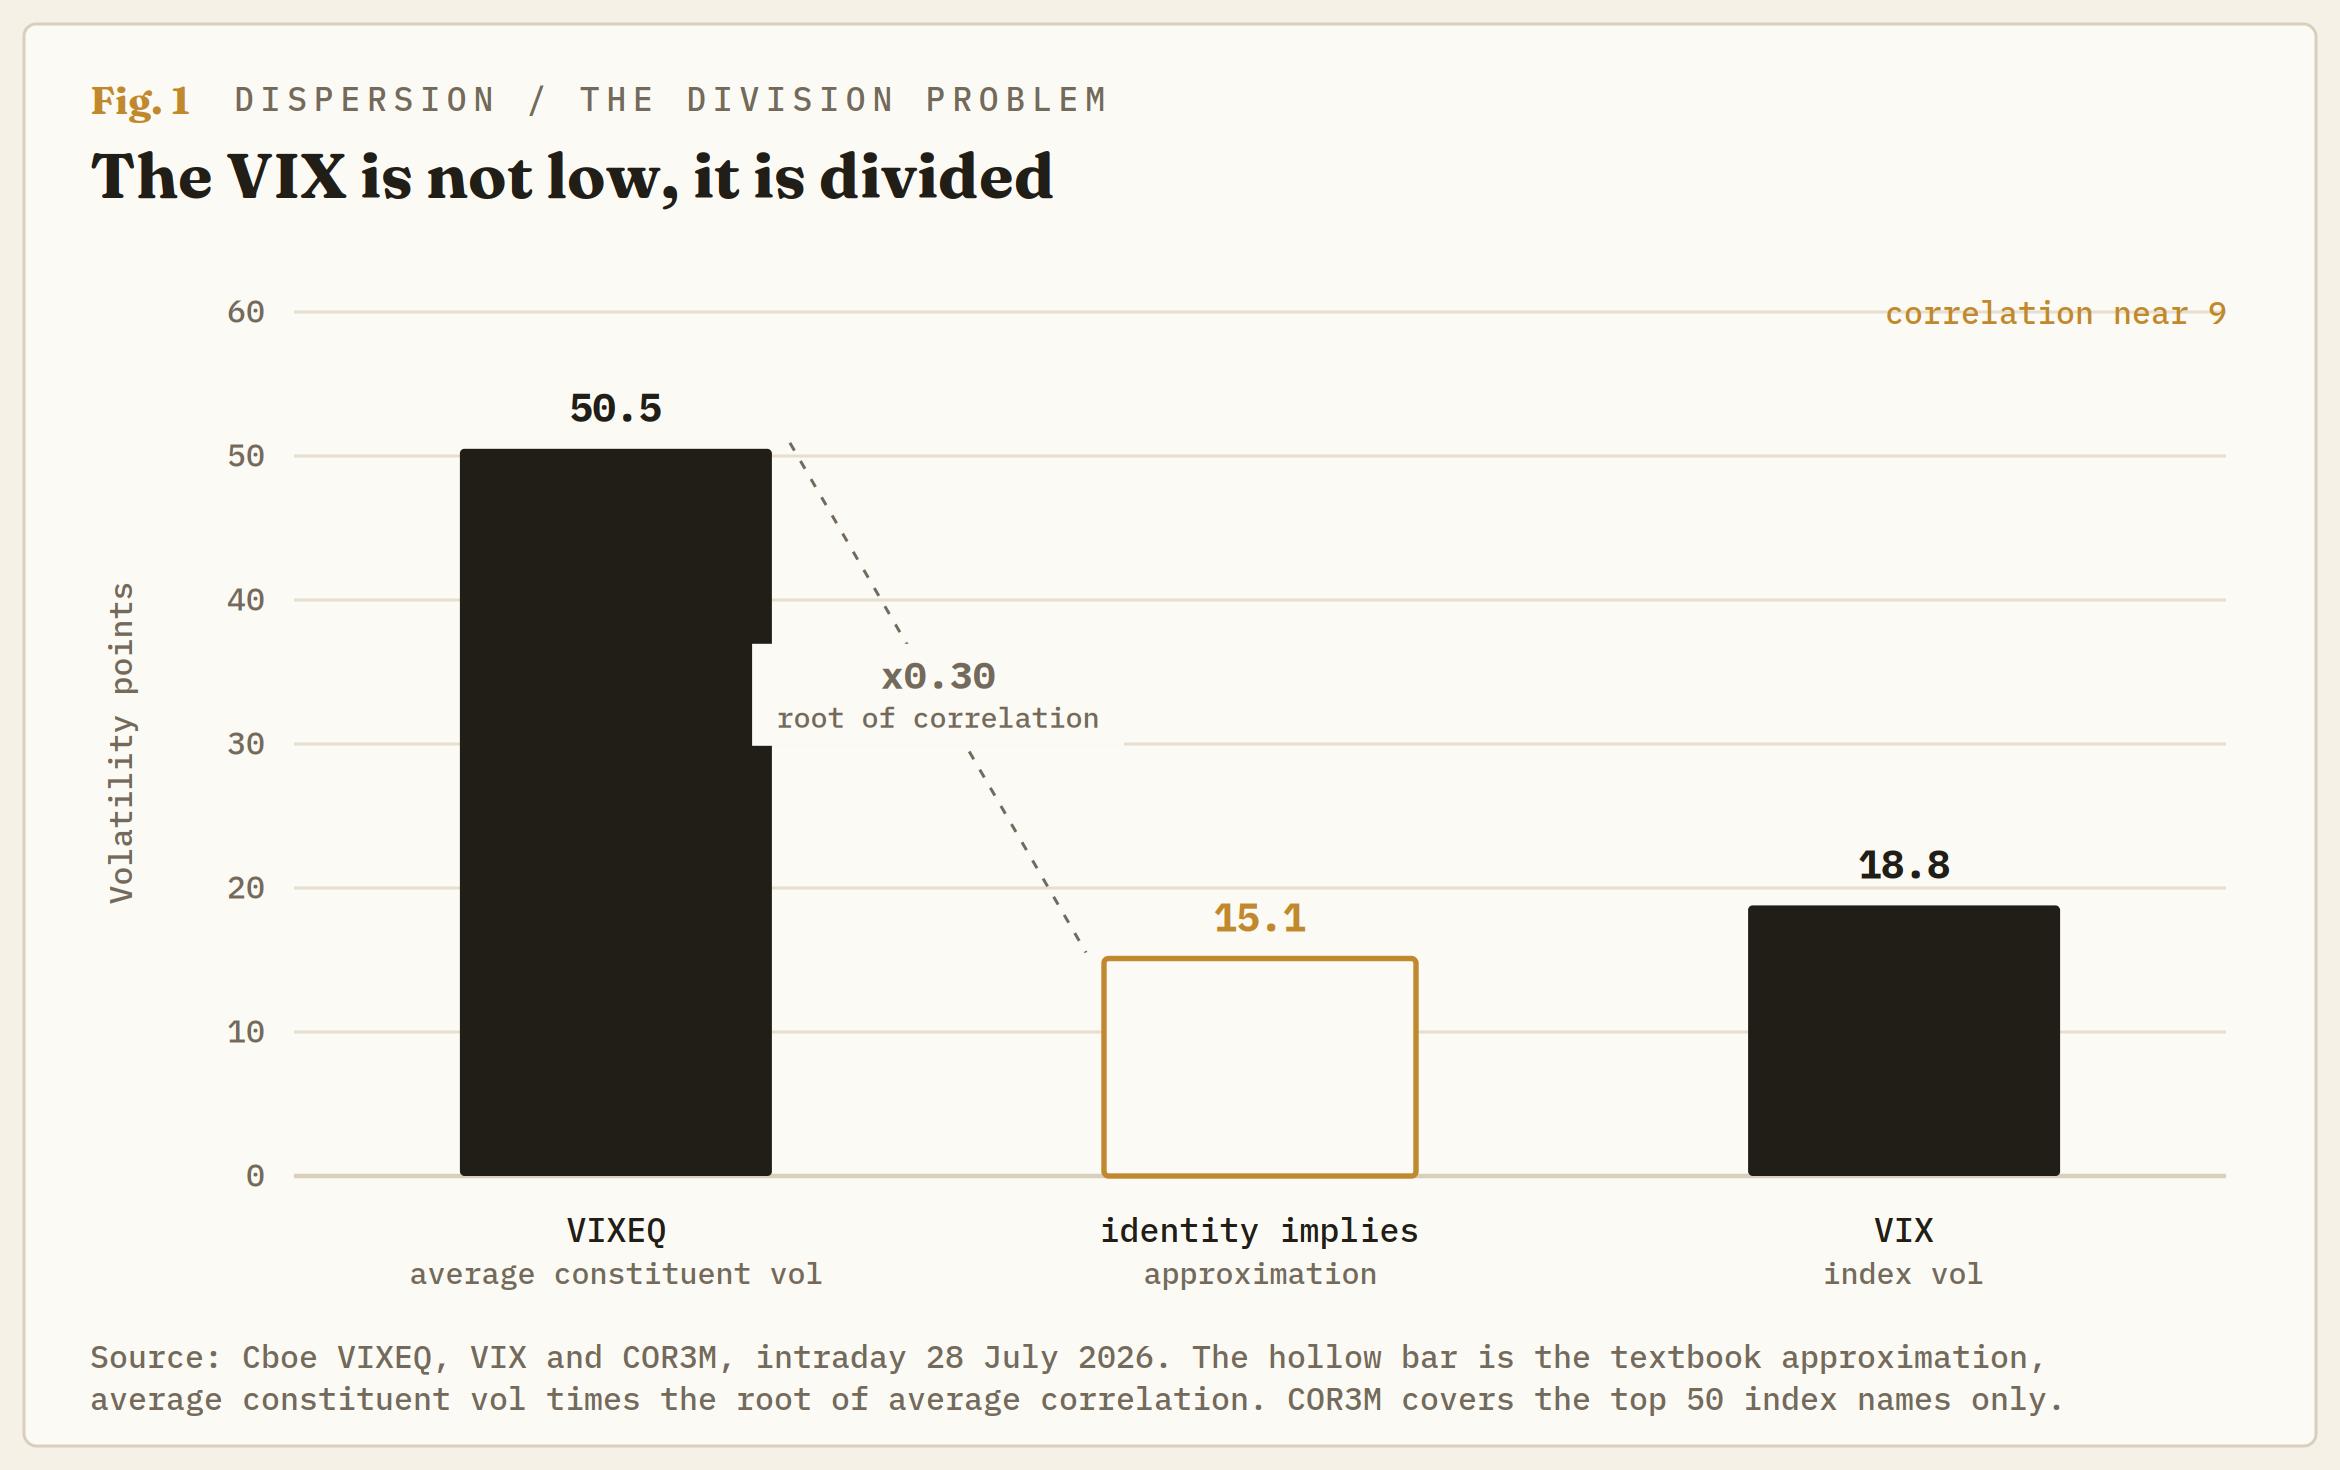
Start with the identity every dispersion desk trades and almost nobody else quotes. Index volatility runs roughly as the average volatility of the constituents multiplied by the square root of the average correlation between them. Both inputs are published, free, and updated through the session. The readings that follow are Tuesday's.
The Cboe S&P 500 Constituent Volatility Index (VIXEQ), which prices the average option on the names inside the index, trades a shade above 50. The Cboe 3-Month Implied Correlation Index (COR3M), which prices how much those names are expected to move together, trades just under 9. The square root of 9% is roughly 0.3. Multiply through and the index inherits under a third of the churn happening underneath it.
That is the entire explanation for a VIX near 19. Not tranquillity, not complacency, not a bullish signal and not a bearish one. Division.
The forward-looking version of that dispersion series has a ticker
The 90-day dispersion series most desks quote is backward-looking, which makes it a description rather than a tool. The Cboe S&P 500 Dispersion Index (DSPX) is the same idea priced forward, built from index and single-stock options on a modified VIX method, and it currently sits near 47 against a 52-week range of roughly 26-50. That is a six-year high, and it is above the peak it made during the April 2025 tariff panic, when the VIX itself traded at 60.
Sit with that for a second. Implied dispersion is now higher than it was in a session where the index vol gauge tripled. The two numbers have come unhitched, and the gap between them is the trade.
The realized series carries the detail that matters most and gets the least attention. In the 2020 panic, dispersion outside technology ran hotter than dispersion inside it, because everything was repricing at once. Today the relationship is inverted and stretched: Information Technology sits near 3.85% while everything else sits near 2.05%, flat for years. This is not a broad dispersion event. It is a single-sector one, in the sector carrying the largest index weight.
Cheap index puts are a short-correlation bet in disguise
The standard advice into this tape, and it is decent advice as far as it goes, is to stop picking stocks, own the index and hedge with cheap index puts. The problem is the word cheap. Index protection is not cheap because sellers are careless. It is cheap because it is priced off a correlation assumption in single digits, and the buyer is inheriting that assumption whether they read it or not.
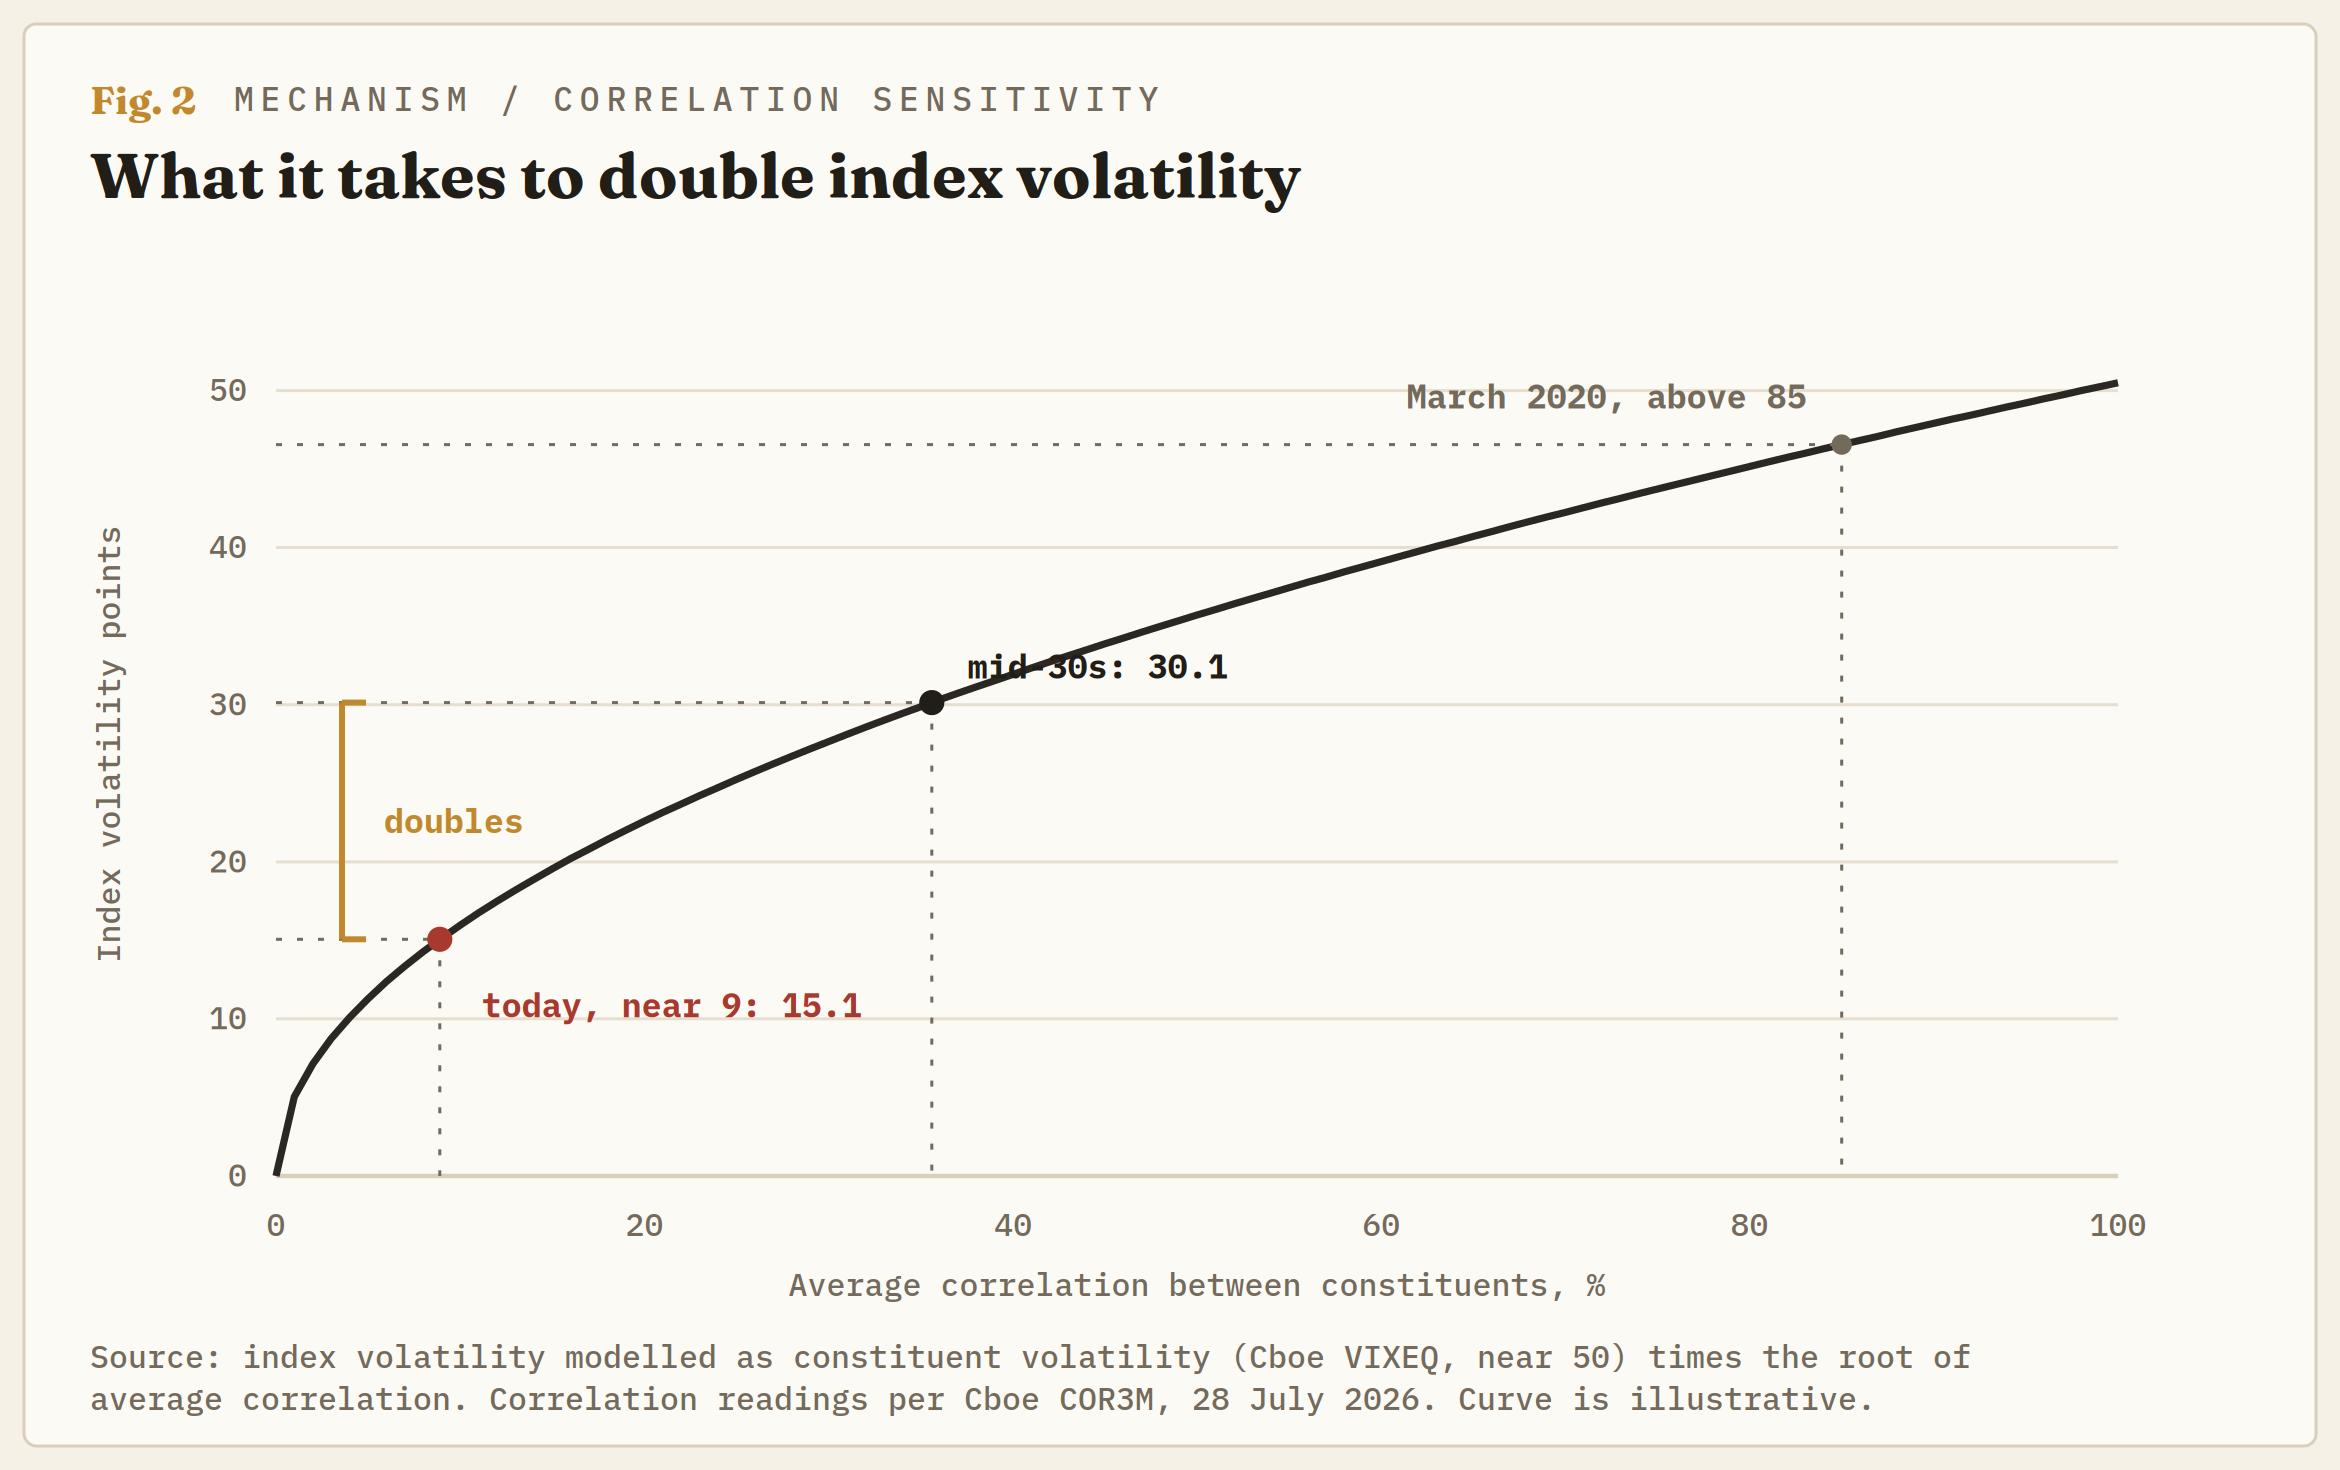
Run the arithmetic backwards. Take correlation from single digits to the mid-30s, a level still comfortably beneath its own long-run average and nowhere near a crisis print. The square root roughly doubles. Index volatility doubles with the constituents doing nothing differently at all. Every stock in the S&P 500 could keep exactly the volatility it has today and index volatility would still reprice violently, purely because the names stopped disagreeing.
Now add the reflexive leg. Dispersion books are short index volatility and long single-stock volatility. When correlation jumps, those books lose on both sides simultaneously and the risk desks behind them become forced buyers of index volatility into a rising tape. That is not a theory. It is what February 2018 looked like, when the VIX more than doubled in a single session, and it is what August 2007 looked like when the quant unwind ran through crowded factor books while the index itself barely flinched. In March 2020 implied correlation went above 85 inside two weeks.
What ends the disagreement
Correlation goes to one when a single shock hits every discount rate in the index at the same moment. Idiosyncratic news, however violent, does the opposite: it is the raw material of dispersion. A memory-maker losing 15% overnight while a paint company beats is a correlation suppressant, not a correlation shock.
There are three candidate shocks on the board, and they are not equally dangerous. The war is the loudest and the least likely to do it, because the tape has now bought four de-escalations since April and the current pause is sourced to target exhaustion rather than agreement. Strait of Hormuz vessel counts running near 140 a day in February, near zero from early March, a partial recovery above 55 in late June, and back near zero by 22 July. The chokepoint has been an equity non-event for five months. That is precisely why it is mispriced as a correlation generator rather than as an Oil story.
Tariffs are the second, and they are a slower burn that lands unevenly across the index, which again feeds dispersion more than it feeds correlation.
The third is the Federal Open Market Committee (FOMC), and it is the clean one. A discount-rate shock is the only event on the calendar that hits every constituent identically, which is the textbook definition of correlation running to one. Kevin Warsh's committee announces on 29 July with no projections attached, a hawkish hold is the consensus expectation, dissents in favour of a hike are being openly discussed, and money markets price a September move at close to 80%. A no-guidance Fed delivering a hawkish surprise into single-digit correlation is the most efficient correlation-manufacturing event available this year.
Record momentum volatility is the wrong alarm bell
Momentum factor volatility is the series everyone is reaching for, and it is being read backwards. Momentum factor volatility above 45 is a record on a series running to 2005, higher than 2008, higher than 2009, higher than the meme squeeze of early 2021.
The academic work on this is unusually clear and unusually ignored. Kent Daniel and Tobias Moskowitz established in Momentum Crashes, published in the Journal of Financial Economics in 2016, that momentum crashes are partly forecastable, that they occur in what the authors call panic states following market declines and during high volatility, and that they arrive contemporaneously with market rebounds rather than with tops. Their finding on mechanism is the sharp one: the winners-minus-losers portfolio behaves like a short call on the market, but only during panic. Outside panic, there is no optionality at all.
Two things follow. The first is that the paper's own dynamic strategy cuts momentum exposure when forecast momentum volatility is high, which is the same conclusion as stop hunting for the next blowout stock, reached by regression twelve years earlier rather than by intuition this month. The second is more awkward. Momentum crashes fire on the rebound, not on the break. Anyone holding that record up as a top signal has the sign wrong.
What is genuinely anomalous is having panic-state factor behaviour with the index within a couple of percent of a record. Either the crash already happened inside the losers and the cap-weighted index papered over it, or the factor is pricing one that has not arrived. Both readings argue rotation risk over crash risk, and both argue that the index level is telling you almost nothing.
A month of single-name carnage the index absorbed without a mark
The evidence has been on the tape since late June. The Elon Musk-founded SpaceX (SPCX), the largest listing of the year, trades roughly 51% below its post-listing high and has spent eight sessions beneath its offer price. IBM lost close to a quarter of its value in one session on a profit warning. Alphabet (GOOGL) fell 6% on a capital spending raise. Tesla (TSLA) fell 13% on a quarterly miss. Nvidia (NVDA) fell 5% on the announcement of its own half-trillion-dollar memory supply agreement.
Any one of those is a bear market in a single name. The index took all five inside five weeks and sits within a couple of percent of its record, while Q2 profits across the S&P 500 are tracking a rise of around 26% on the year. That is not resilience. That is what a correlation of nine looks like from the outside.
The five tells that actually date the turn
Dispersion does not call tops. It sets the speed of whatever comes next, which is a different and more useful thing to know. The watch list, all of it free:
- COR1M and COR3M turning up while the index is still rising. The one-month gauge lifted around 37% off a base near 6 on the Tuesday open. That is the first flicker, and it is the tell that leads.
- The VIXEQ-to-VIX spread compressing from its record near 34 points. Compression means the trade is unwinding and index vol is losing its mechanical suppressant.
- DSPX rolling over from a six-year high. The index typically falls after earnings season. If it does not roll this time, the disagreement is not cyclical.
- The Cboe SKEW Index near 147, which says tail hedges are already bid even while at-the-money index protection is not. Somebody is not buying the calm.
- Breadth splits of the kind running this week, Dow futures bid while NASDAQ-100 futures are offered. When those two stop diverging and start falling together, the regime has changed and the arithmetic above stops working in your favour.
For the reader who wants the raw material rather than the commentary, all five Cboe series carry public tickers and stream free through most quote pages. The S&P and Dow Jones indices publish a monthly Dispersion, Volatility and Correlation dashboard with percentile bands running back to 2007, which is the single most useful free document in this corner of the market and is read by almost nobody outside of volume desks.
So, is this the top?
Probably not this week, and dispersion is not the reason to think either way. The honest reading is less satisfying and more actionable: the market has arranged itself so that whatever eventually breaks, it will break it faster than the news deserves.
Single-digit correlation is not a warning that the top is in. It is a measurement of fuse length. Fuses do not tell you when someone will light them. They tell you how much time you have between the match and the bang, and right now that number is the shortest it has been in six years, with a no-guidance Fed holding the matches and announcing on 29 July.
Author

Joshua Gibson
FXStreet
Joshua joins the FXStreet team as an Economics and Finance double major from Vancouver Island University with twelve years' experience as an independent trader focusing on technical analysis.