PepsiCo earnings day: Two resistance levels traders should watch
PepsiCo is one of the most recognized consumer staples companies in the world, operating a portfolio of beverage and snack brands that most households interact with on a daily basis. It also happens to be a publicly traded stock that we can chart like any other asset — and today is an earnings day, which makes the levels on this chart even more relevant right now.
Current chart analysis on PEP
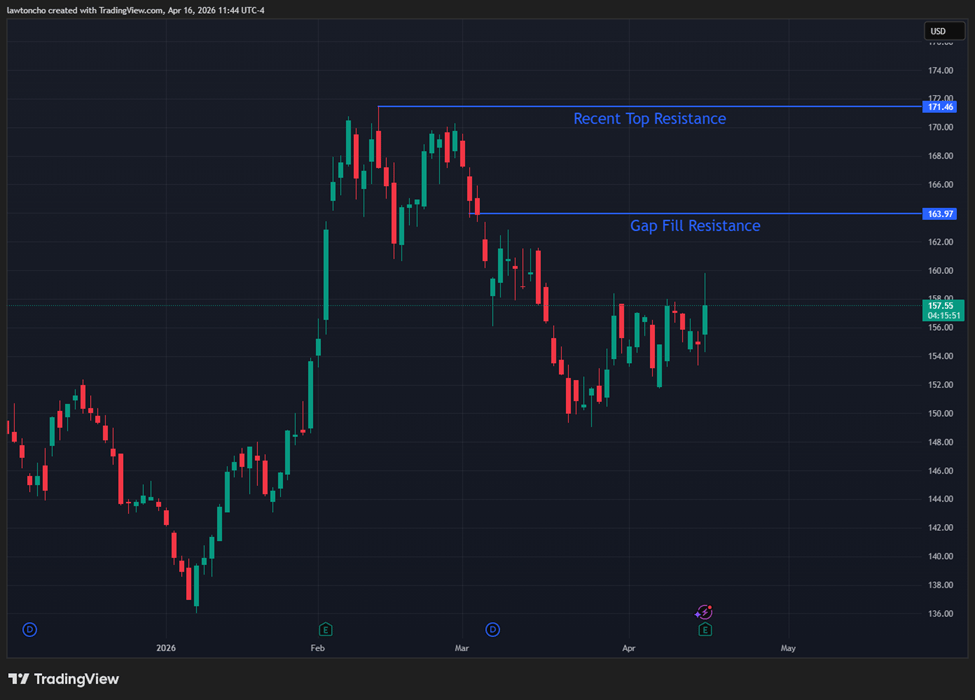
PEP is trading around $157.55 today, and with earnings out this morning, the stock is sitting in an interesting spot technically. After rallying from lows near $137 in mid-January all the way up to the recent top near $171.46 in early February, PepsiCo has since pulled back and spent the past several weeks consolidating in the $152 to $160 range. The bounce off the lows is noteworthy, but the chart still has two resistance levels overhead that are going to define whether this stock can actually build on any post-earnings momentum.
I want to be clear about how I approach earnings — earnings can move a stock in either direction, and the technicals don't predict that. What they do is tell you where price is likely to run into resistance if it moves higher, and where things get complicated if it moves lower.
Key PEP resistance levels after earnings
The first level I'm watching is the gap fill resistance at $163.97. That open gap was created during the selloff in early March, and price has not been back to close it. At $157.55, PEP is about six dollars below that level.
If today's earnings reaction pushes the stock higher, $163.97 is the first area where I'd expect sellers to start showing up. That gap has been sitting open for several weeks and unfilled gaps tend to act as magnets, but they also tend to create friction on the first attempt through.
Above that sits the recent top resistance at $171.46. That's the swing high from early February, forming the peak of the rally before the selloff began. Getting back to $171.46 would essentially mean recovering the entire decline from the February highs, and that's not something that typically happens in a straight line. If $163.97 gets cleared with conviction, then $171.46 becomes the next conversation.
What to watch next on PEP stock
If the earnings reaction is negative and price loses the $153 to $154 area on a daily closing basis, the lows near $150 come back into focus quickly. That's the level I'd be watching on the downside as the next meaningful area of support.
For now, the setup is straightforward. The gap fill at $163.97 is the first test, and how price responds to that level, whether on an earnings pop or a gradual grind higher, will answer the question about whether PepsiCo has the buying pressure to push further into the resistance zone above it.
Aside from approaching the setup thoughtfully, make sure you are always utilizing proper risk management strategies.
Author

Lawton Ho
Verified Investing
A marketing expert sharing his journey to mastering the charts.














