Palantir’s potential pullback level ahead

Palantir popped in pre-market trading today, and if it can get up to the $155 level, we can expect to see a pullback at this critical resistance zone. The $155 area represents the top of a wide-range red bar candle and aligns with a downsloping trendline that's connected previous pivot highs, making this a confluence zone where multiple forms of resistance intersect and a pullback becomes highly possible — even if it is temporary.
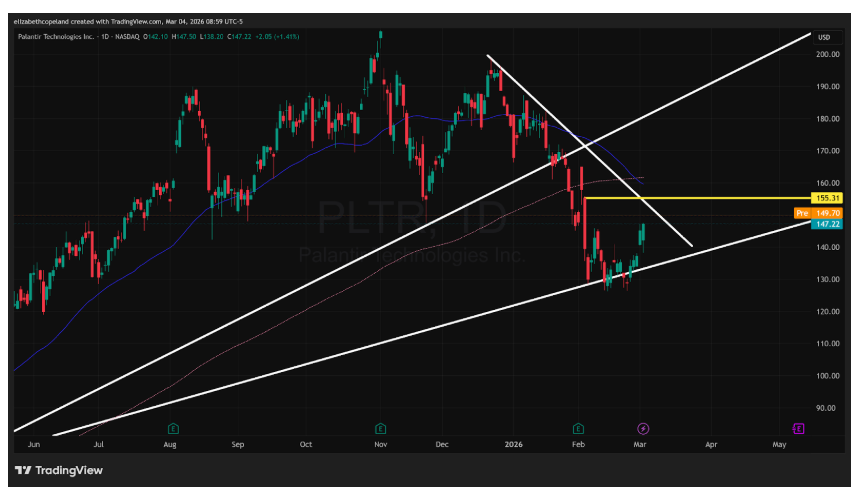
Wide-range candle tops mark areas where significant selling occurred, and downsloping trendlines act as descending ceilings that have repeatedly rejected price, so the combination creates a strong technical barrier. If that $155 level is broken with conviction, there's a gap fill just $2 higher that becomes the next target for this move. Gap fills act as magnets where price tends to gravitate, and breaking through $155 would put that gap squarely in focus as the next resistance zone.
However, it's critical to remember that this stock can move 10-15% in a single day, which means proper risk management is key when trading PLTR. The volatility that creates opportunity also creates substantial risk if you're caught on the wrong side of a reversal.
If both the $155 resistance and the gap fill $2 higher are broken, there's an area of consolidation around the $167 level above these points that could mean some hesitation for the stock to push higher. This consolidation zone represents a price area where PLTR spent time trading back and forth, creating a “memory” of supply and demand balance that often produces resistance when price returns. That would be an 11% upside move from current levels until it hits this $167 consolidation area, which is entirely possible given PLTR's tendency to make large single-day moves.
For traders watching this stock, the roadmap is clear: $155 is the first major test with the wide-range candle top and downsloping trendline, then the gap fill $2 higher if that breaks, and finally the $167 consolidation zone if momentum carries price through both lower resistance levels. Each of these zones mark a potential inflection point where the rally could stall or reverse, so position sizing and stop placement become critical given how fast PLTR can move in either direction.
Author

Elizabeth Copeland
Verified Investing
Elizabeth is a trader and financial journalist who uses her sharp analytical skills to spot market shifts early and trade with precision.