NZD/USD Price Forecast: Kiwi breaks below 0.5800 as bears take control
- NZD/USD hits near two-month low after rejecting SMA confluence.
- Bearish RSI signals sellers control the short-term technical bias.
- Break below 0.5800 exposes 0.5761, 0.5750 and 0.5658.

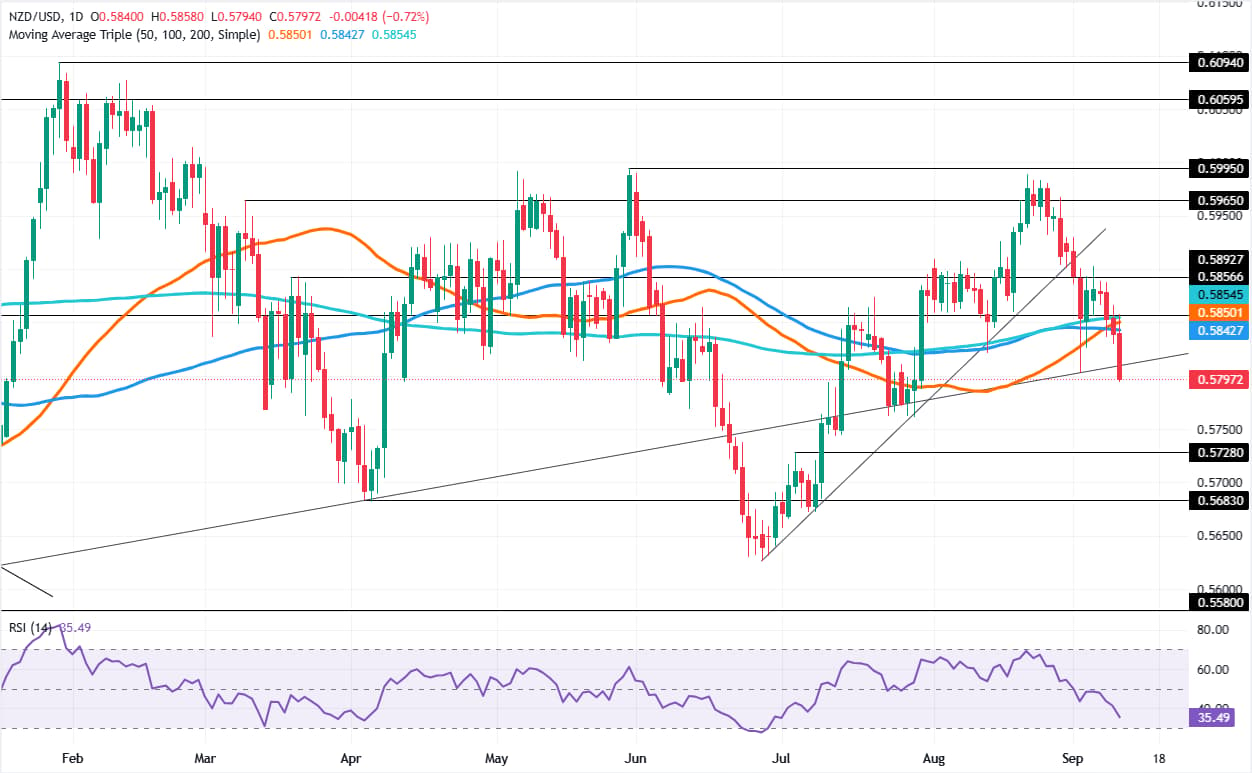
The New Zealand Dollar (NZD) fails to clear a confluence of key Simple Moving Averages (SMAs) and dives below 0.5800 on Thursday, printing a near two-month low of 0.5797. At the time of writing, NZD/USD is down 0.65% and poised to test lower levels if it closes below 0.5800.
NZD/USD Price Forecast: Technical Outlook
From a technical perspective, the NZD/USD pair shifted to a downward bias. After clearing the confluence of the 100-, 50- and 200-day Simple Moving Averages (SMAs) at 0.5854, 0.5850 and 0.5842, it opened the door to breach the 0.5800 mark.
Also, overall US Dollar strength, driven by money markets expecting a rate hike by the Federal Reserve (Fed), shifted momentum in favor of the Greenback. The Relative Strength Index (RSI) turned bearish, an indication that further downside is expected.
If NZD/USD dives below 0.5800, the next support would be the July 29 low of 0.5761. Below is the 0.5750 psychological level, before printing a leg down to the July 3 high, which turned support at 0.5658.
Should buyers move in and push NZD/USD above 0.5855, it will expose 0.5900. On further strength, the next key resistance levels are the 0.6000 figure, followed by the February 18 swing high of 0.6054.
NZD/USD Price Chart – Daily
New Zealand Dollar Price Today
The table below shows the percentage change of New Zealand Dollar (NZD) against listed major currencies today. New Zealand Dollar was the strongest against the Australian Dollar.
| USD | EUR | GBP | JPY | CAD | AUD | NZD | CHF | |
|---|---|---|---|---|---|---|---|---|
| USD | 0.16% | 0.25% | 0.52% | 0.18% | 0.81% | 0.71% | 0.33% | |
| EUR | -0.16% | 0.09% | 0.38% | 0.00% | 0.65% | 0.56% | 0.17% | |
| GBP | -0.25% | -0.09% | 0.27% | -0.09% | 0.55% | 0.47% | 0.08% | |
| JPY | -0.52% | -0.38% | -0.27% | -0.37% | 0.28% | 0.16% | -0.20% | |
| CAD | -0.18% | -0.00% | 0.09% | 0.37% | 0.65% | 0.55% | 0.17% | |
| AUD | -0.81% | -0.65% | -0.55% | -0.28% | -0.65% | -0.09% | -0.48% | |
| NZD | -0.71% | -0.56% | -0.47% | -0.16% | -0.55% | 0.09% | -0.35% | |
| CHF | -0.33% | -0.17% | -0.08% | 0.20% | -0.17% | 0.48% | 0.35% |
The heat map shows percentage changes of major currencies against each other. The base currency is picked from the left column, while the quote currency is picked from the top row. For example, if you pick the New Zealand Dollar from the left column and move along the horizontal line to the US Dollar, the percentage change displayed in the box will represent NZD (base)/USD (quote).
Author

Christian Borjon Valencia
FXStreet
Markets analyst, news editor, and trading instructor with over 14 years of experience across FX, commodities, US equity indices, and global macro markets.