NZD/USD Price Forecast: Clinging to 0.5800 support as risk appetite ebbs
- NZD/USD finds support in the 0.5800 area after Monday's reversal from 0.5864.
- Mixed data from China and caution about the US-Iran deal are weighing on the New Zealand Dollar on Tuesday.
- Technically, the pair is forming an inverted Head & Shoulders pattern.

The New Zealand Dollar (NZD) posts marginal losses against the US Dollar (USD) on Tuesday, trading at 0.5820 after bouncing up from session lows at 0.5795. The pair, however, remains vulnerable, following Monday’s rejection above 0.5860, weighed by a more cautious market mood and mixed data from China, a key partner.
Chinese Industrial production rose 4.5% year-on-year in May, beating expectations of a 4.4% reading, boosted by overseas trading, despite the restricted global shipping amid the crisis in the Strait of Hormuz. Retail Sales, on the other hand, fell 0.6% against expectations of a flat reading, revealing that domestic demand remains sluggish.
Beyond that, market sentiment has turned cautious, with investors awaiting details on the US-Iran peace deal, particularly regarding navigation through the Strait of Hormuz and Iran’s nuclear programme. This has provided some support for the US Dollar, which is also drawing support from investors' reluctance to bet against the USD ahead of Wednesday's Federal Reserve (Fed) decision.
Technical Analysis: Forming a bullish Head & Shoulders pattern
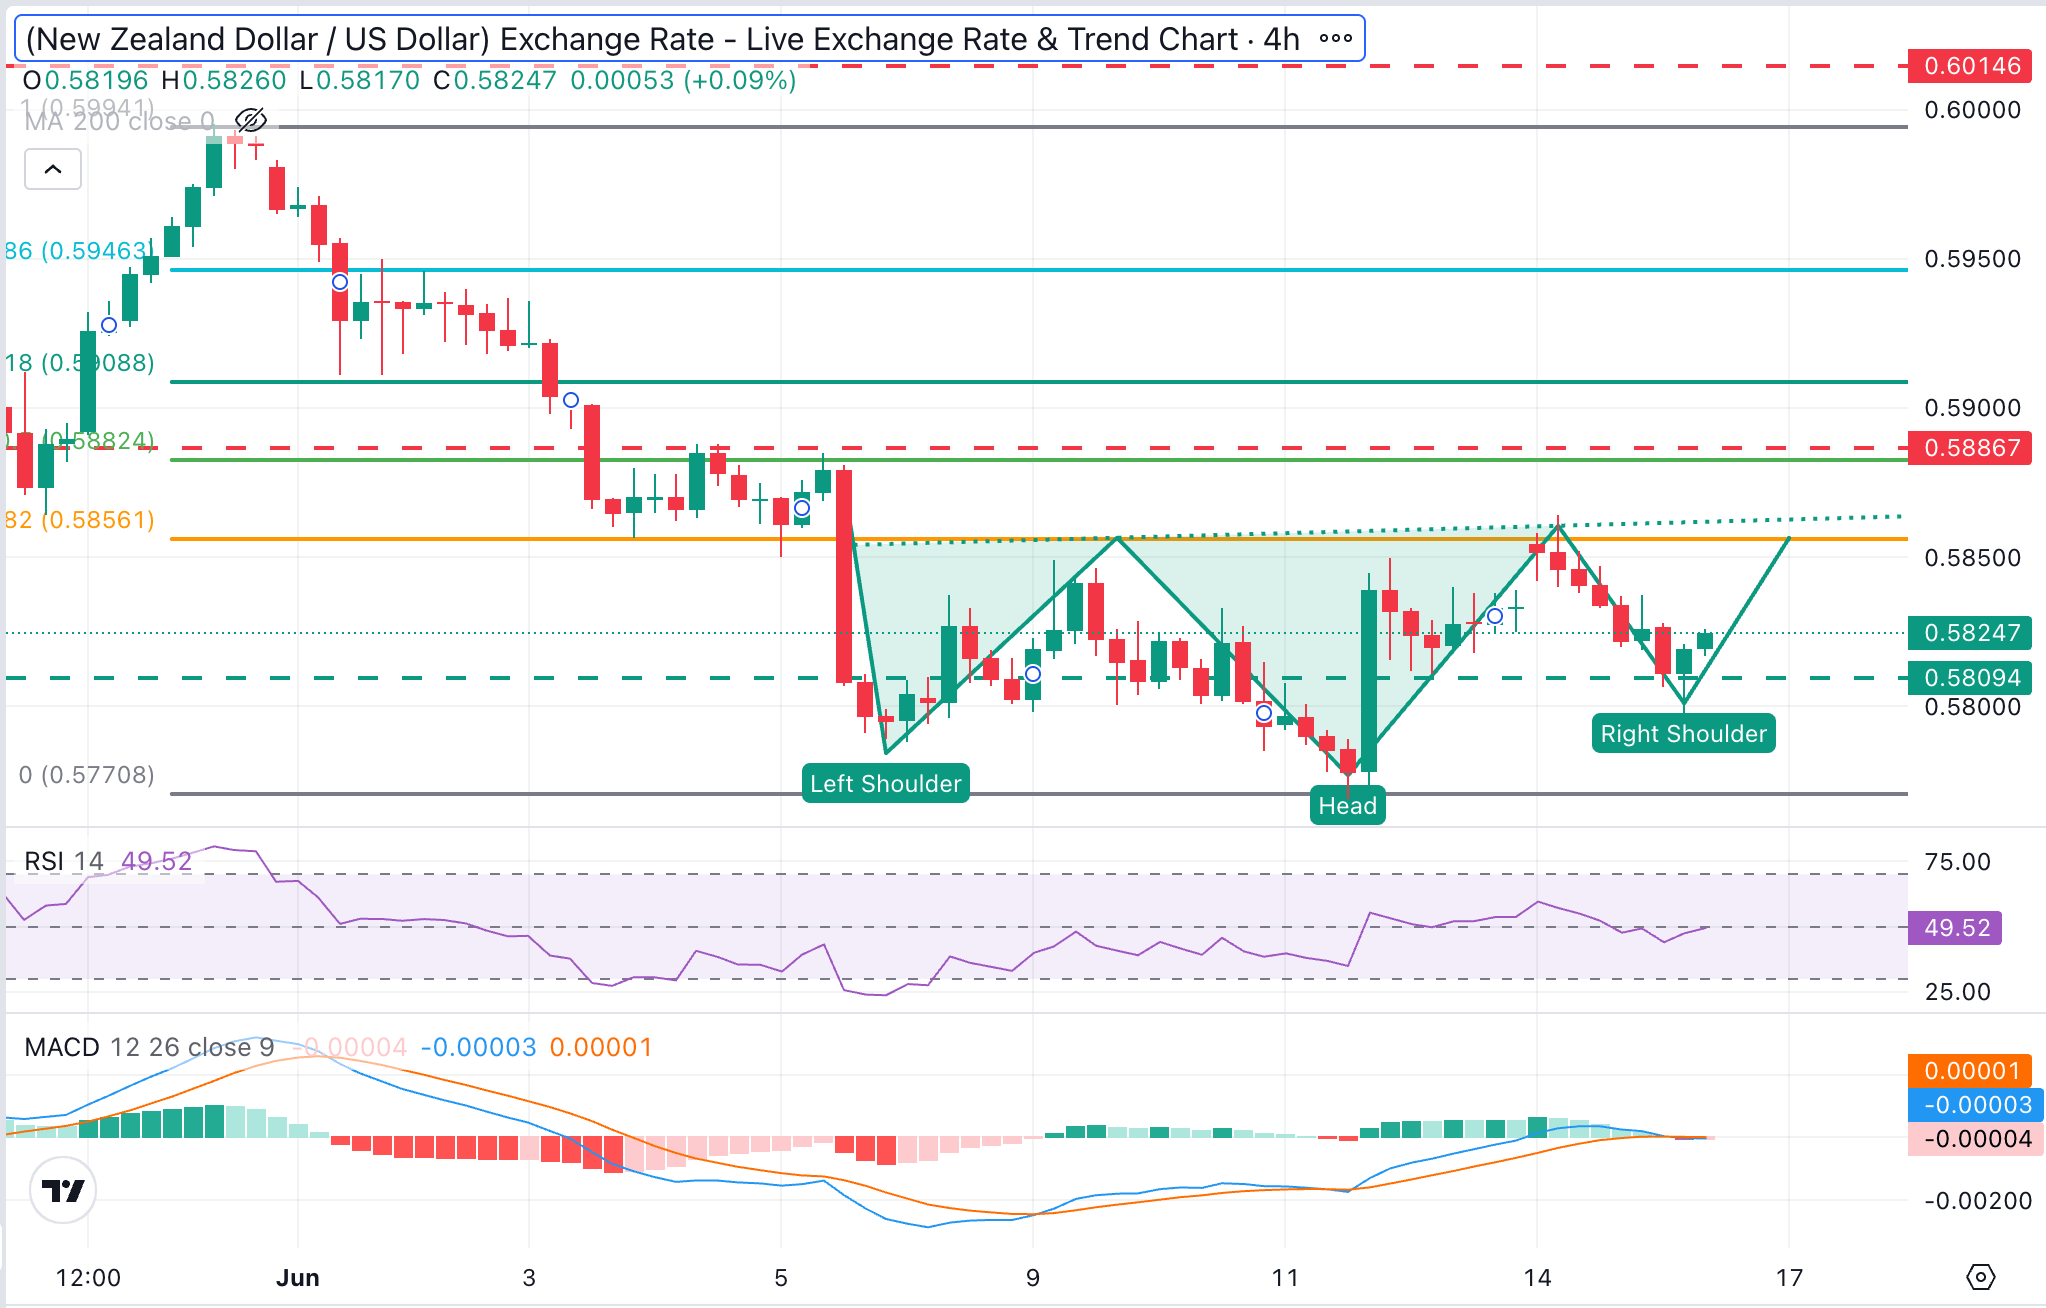
NZD/USD is bouncing up from session lows, forming an inverted Head & Shoulders (H&S) pattern, a common figure for trend shifts. Indicators in the 4-hour chart, however, show a lack of momentum. The Relative Strength Index (RSI) is around 50, while the Moving Average Convergence Divergence (MACD) has slipped marginally into negative territory, hinting that recovery attempts could remain shallow.
The H&S neckline meets the 38.2% Fibonacci retracement of the early-June selloff at 0.5857. Further up the June 4 and 5 highs, at the 0.5890 area and the 61.8% Fibonacci retracement of the mentioned cycle, at 0.5910 would be the next targets.
On the downside, initial support emerges at the mentioned 1.5800 area (session low), which is closing the path towards Thursday's low, at the 0.5760 area. Further down, the next bearish target is the year-to-date low, at the 0.5680 area.
(The technical analysis of this story was written with the help of an AI tool.)
New Zealand Dollar Price Today
The table below shows the percentage change of New Zealand Dollar (NZD) against listed major currencies today. New Zealand Dollar was the strongest against the Canadian Dollar.
| USD | EUR | GBP | JPY | CAD | AUD | NZD | CHF | |
|---|---|---|---|---|---|---|---|---|
| USD | -0.12% | -0.05% | -0.03% | 0.09% | 0.07% | -0.06% | 0.00% | |
| EUR | 0.12% | 0.08% | 0.13% | 0.22% | 0.19% | 0.06% | 0.13% | |
| GBP | 0.05% | -0.08% | 0.04% | 0.14% | 0.10% | -0.01% | 0.06% | |
| JPY | 0.03% | -0.13% | -0.04% | 0.10% | 0.07% | -0.04% | 0.04% | |
| CAD | -0.09% | -0.22% | -0.14% | -0.10% | -0.03% | -0.16% | -0.09% | |
| AUD | -0.07% | -0.19% | -0.10% | -0.07% | 0.03% | -0.12% | -0.04% | |
| NZD | 0.06% | -0.06% | 0.01% | 0.04% | 0.16% | 0.12% | 0.07% | |
| CHF | -0.01% | -0.13% | -0.06% | -0.04% | 0.09% | 0.04% | -0.07% |
The heat map shows percentage changes of major currencies against each other. The base currency is picked from the left column, while the quote currency is picked from the top row. For example, if you pick the New Zealand Dollar from the left column and move along the horizontal line to the US Dollar, the percentage change displayed in the box will represent NZD (base)/USD (quote).
Author

Guillermo Alcala
FXStreet
Graduated in Communication Sciences at the Universidad del Pais Vasco and Universiteit van Amsterdam, Guillermo has been working as financial news editor and copywriter in diverse Forex-related firms, like FXStreet and Kantox.
















