NZD/USD Price Forecast: Bears test support at 200-day SMA as risk appetite fades
- NZD/USD hits session lows at 0.5936 on Tuesday, exploring prices below the 200-day SMA.
- Escalating tensions in the Middle East and higher Oil prices are weighing on the Kiwi.
- A break of the 0.5800 level would confirm a bearish H&S pattern.

The New Zealand Dollar extends losses against the US Dollar (USD) on Tuesday, weighed by the risk-off mood amid escalating tensions in the Middle East and rising Oil prices. The NZD/USD extends its reversal from the 0.5900 area on Friday, reaching session lows at 0.5836, below the key 200-day Simple Moving Average (SMA) which lies at the 0.5850 area.
Market sentiment remains subdued as tensions between the US and Iran escalate further, pushing back hopes of a negotiated end to the conflict. Tehran threatened to strike US Gas and Oil interests in Gulf countries if Iran is attacked again, following another round of hostilities over the weekend.
Meanwhile, traffic through the Strait of Hormuz, which carried about 20% of global Oil supply before the war, remains limited to a trickle, which is pushing prices higher. Brent Oil is trading above $97.00 per barrel on Tuesday's European session, accumulating a nearly 9% appreciation so far in September, and 38% above July lows. These prices increase the exposure of New Zealand’s economy to another Energy shock.
Earlier on the day, data from China revealed that the trade surplus increased in August, although imports missed expectations, which suggests that the country's domestic demand remains weak. The data failed to provide any noticeable support to the China-proxy NZD.
Technical Analysis: Approaching the trendline of a bearish H&S
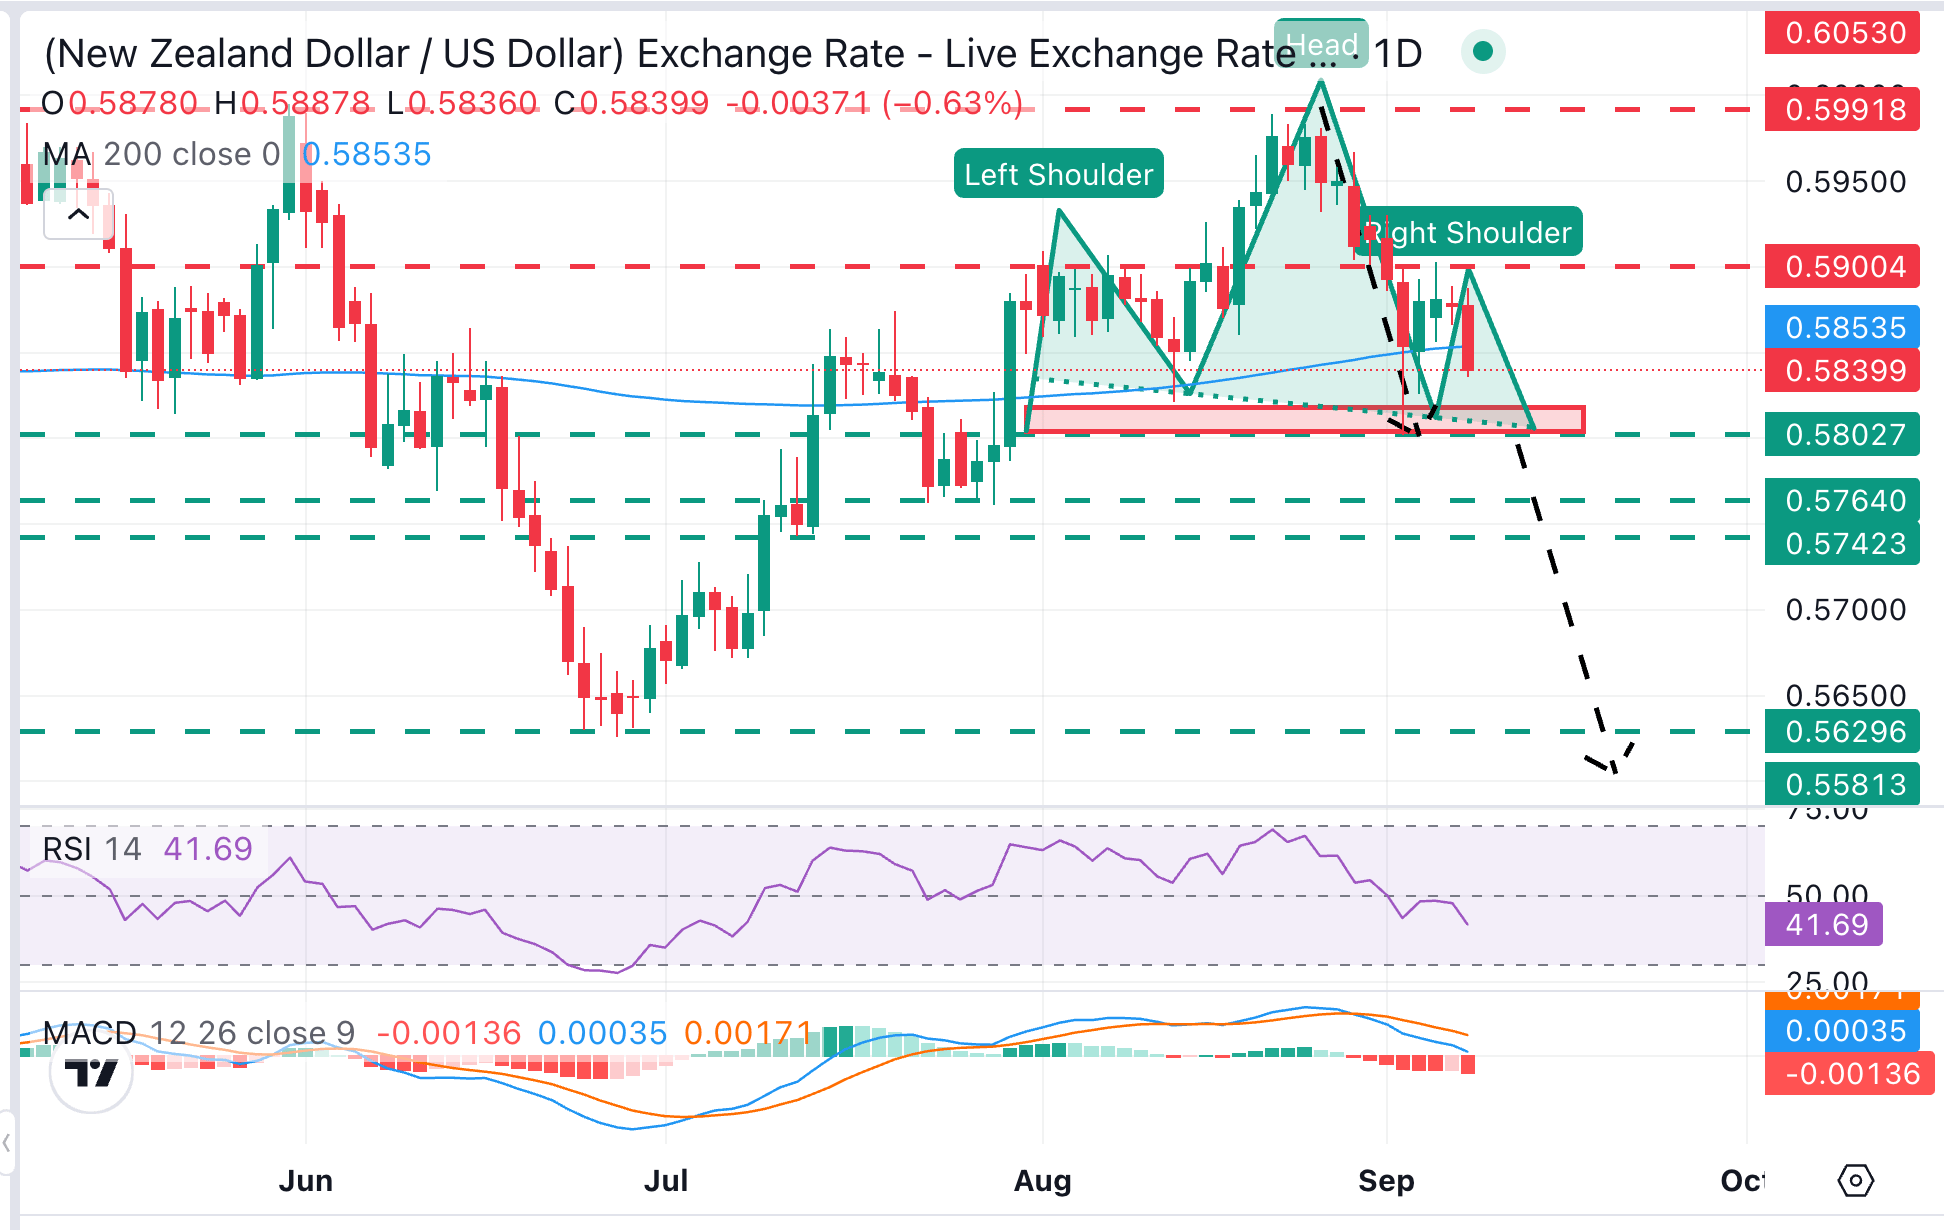
NZD/USD trades at 0.5843, holding a bearish near-term tone as it slips just below the 200-day simple moving average (SMA) at 0.5854 and draws closer to the neckline of a bearish Head & Shoulders (H&S) pattern, between 0.5800 and 0.5820. Momentum indicators show a growing bearish trend, as the Relative Strength Index (RSI) eases toward the low-40s and the Moving Average Convergence Divergence (MACD) line sits below zero with a negative histogram.
A break of the 0.5800 level would confirm an H&S pattern, adding pressure towards the late July lows, near 0.5765 and the July 13 low, at 0.5745. The H&S's measured target is below the June 26 low at 0.5626.
On the topside, Bulls should break Friday's high at the 0.5900 area to ease bearish pressure and shift the focus toward the late August highs at the 0.5990 area.
(The technical analysis of this story was written with the help of an AI tool. Know more.)
New Zealand Dollar Price Today
The table below shows the percentage change of New Zealand Dollar (NZD) against listed major currencies today. New Zealand Dollar was the strongest against the Swiss Franc.
| USD | EUR | GBP | JPY | CAD | AUD | NZD | CHF | |
|---|---|---|---|---|---|---|---|---|
| USD | 0.09% | 0.11% | -0.14% | -0.09% | 0.13% | 0.63% | 0.25% | |
| EUR | -0.09% | 0.01% | -0.23% | -0.17% | 0.02% | 0.55% | 0.16% | |
| GBP | -0.11% | -0.01% | -0.25% | -0.19% | 0.00% | 0.54% | 0.15% | |
| JPY | 0.14% | 0.23% | 0.25% | 0.07% | 0.28% | 0.80% | 0.42% | |
| CAD | 0.09% | 0.17% | 0.19% | -0.07% | 0.21% | 0.73% | 0.35% | |
| AUD | -0.13% | -0.02% | -0.01% | -0.28% | -0.21% | 0.53% | 0.14% | |
| NZD | -0.63% | -0.55% | -0.54% | -0.80% | -0.73% | -0.53% | -0.38% | |
| CHF | -0.25% | -0.16% | -0.15% | -0.42% | -0.35% | -0.14% | 0.38% |
The heat map shows percentage changes of major currencies against each other. The base currency is picked from the left column, while the quote currency is picked from the top row. For example, if you pick the New Zealand Dollar from the left column and move along the horizontal line to the US Dollar, the percentage change displayed in the box will represent NZD (base)/USD (quote).
Author

Guillermo Alcala
FXStreet
Graduated in Communication Sciences at the Universidad del Pais Vasco and Universiteit van Amsterdam, Guillermo has been working as financial news editor and copywriter in diverse Forex-related firms, like FXStreet and Kantox.