|

NZD/USD Price Analysis: Trades near 0.6170, advances towards a barrier at 38.2% Fibonacci

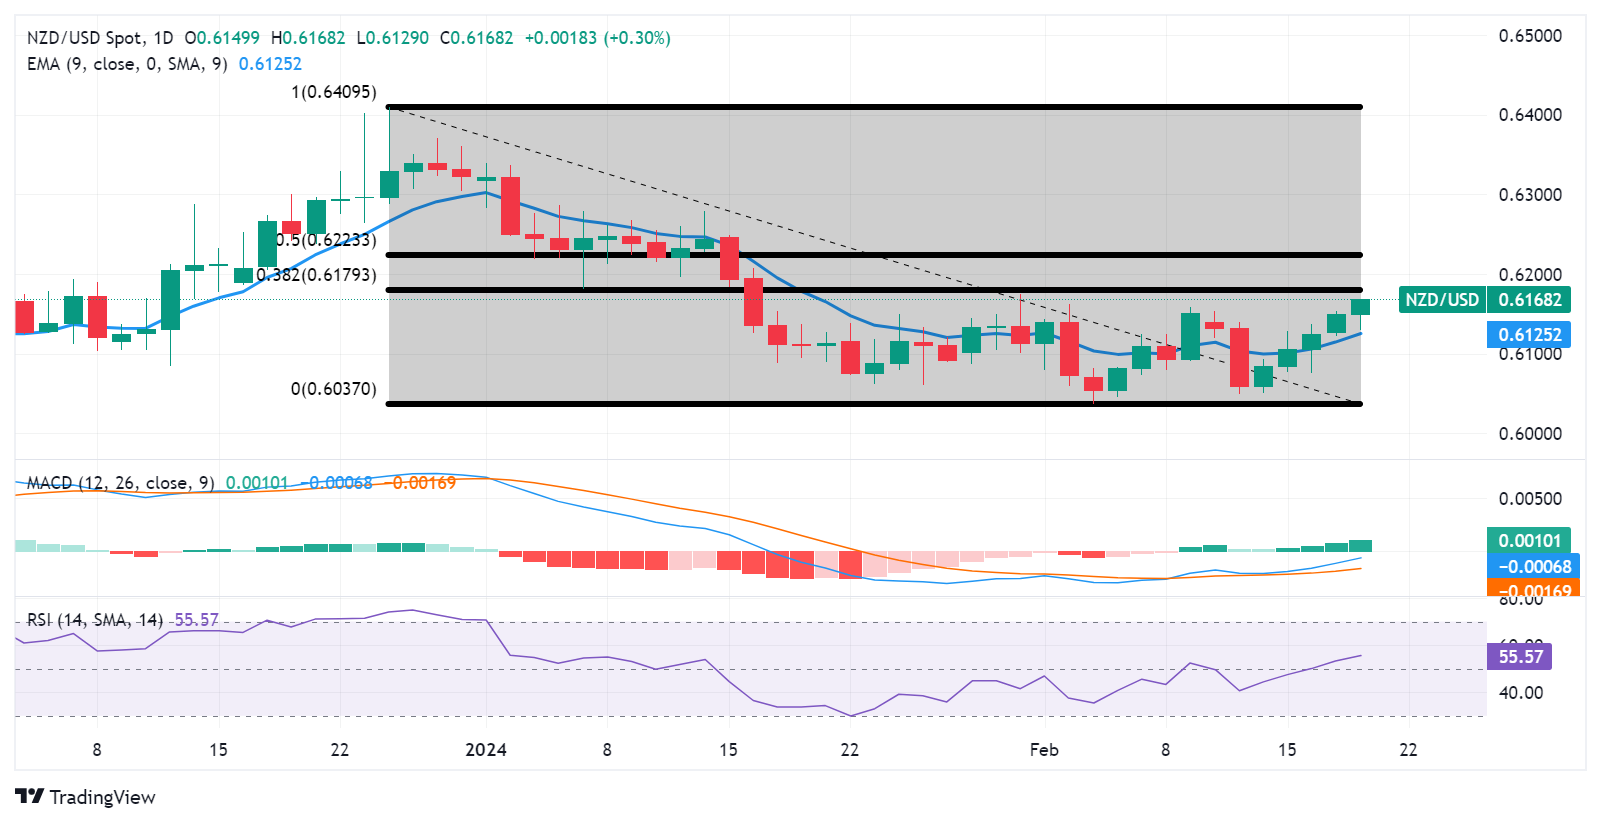
  • NZD/USD could surpass the resistance level of 38.2% Fibonacci retracement at 0.6179.
  • A break above the 0.6200 could prompt the pair test 50.0% retracement level of 0.6223.
  • The pair could meet the support at the nine-day EMA at 0.6124
  • Technical analysis suggests a momentum shift towards an upward direction.

NZD/USD continues to move on an upward trajectory for the fifth successive session on Tuesday as the US Dollar (USD) trims daily gains to extend its losses. The NZD/USD pair surges to near 0.6170 during the European trading hours.

The NZD/USD pair could find immediate resistance around the 38.2% Fibonacci retracement at 0.6179 followed by the psychological resistance level of 0.6200. A firm break above this psychological barrier could exert upward support for the pair to explore the region around the 50.0% retracement level of 0.6223.

The technical analysis of the NZD/USD pair suggests a momentum shift towards upward direction. The Moving Average Convergence Divergence (MACD) line is situated below the centerline but shows divergence above the signal line.

Furthermore, the lagging indicator 14-day Relative Strength Index (RSI) lies above the 50 level, suggesting a bullish sentiment for the NZD/USD pair.

On the downside, the NZD/USD pair could find immediate support at the major level of 0.6150. A break below the latter could put the downward pressure on the NZD/USD pair to test the nine-day Exponential Moving Average (EMA) at 0.6124 to approach the psychological level of 0.6100.

NZD/USD: Daily Chart
NZD/USD: other levels to watch

Overview
Today last price0.6168
Today Daily Change0.0018
Today Daily Change %0.29
Today daily open0.615
 
Trends
Daily SMA200.6107
Daily SMA500.6181
Daily SMA1000.6079
Daily SMA2000.6078
 
Levels
Previous Daily High0.6153
Previous Daily Low0.6122
Previous Weekly High0.6153
Previous Weekly Low0.6049
Previous Monthly High0.6339
Previous Monthly Low0.6061
Daily Fibonacci 38.2%0.6141
Daily Fibonacci 61.8%0.6134
Daily Pivot Point S10.613
Daily Pivot Point S20.6111
Daily Pivot Point S30.61
Daily Pivot Point R10.6161
Daily Pivot Point R20.6172
Daily Pivot Point R30.6192

Author

Akhtar Faruqui

Akhtar Faruqui is a Forex Analyst based in New Delhi, India. With a keen eye for market trends and a passion for dissecting complex financial dynamics, he is dedicated to delivering accurate and insightful Forex news and analysis.


More from Akhtar Faruqui
Share:

Editor's Picks

GBP/USD remains offered near 1.3470

GBP/USD adds to the multi-day negative streak and retreats toward the 1.3470 zone on Wednesday, or four-week troughs. Cable’s deep correction comes on the back of the unabated recovery in the Greenback and the persistent geopolitical concerns.

EUR/USD bounces off lows; still below 1.1600 post-ADP

EUR/USD now manages to pick up some pace and revisits the 1.1580 region on Wednesday. That said, the pair rebounds from earlier two-week lows following some loss of momentum in the US Dollar soon after the ADP report came in short of expectations in August.

Gold treads water above $4,300

Following an earlier pullback to the $4,280 region per troy ounce, Gold prices now regain some composure and reclaim the $4,300 mark, advancing modestly for the day and setting aside three consecutive days of losses. The precious metal’s lacklustre rebound comes amid modest gains in the US Dollar, steady geopolitical uncertainty and mixed US Treasury yields.

WTI advances to mid-$90.00s, fresh high since July 24 amid escalating US-Iran tensions

West Texas Intermediate (WTI) – the benchmark US Crude Oil price – scales higher for the third straight day – also marking the fifth day of a positive move in the previous six – and climbs to a fresh high since July 24 during the Asian session on Wednesday.

Crypto Today: Bitcoin, Ethereum, XRP edge lower as renewed US-Iran tensions weigh

The cryptocurrency market is pulling back broadly on Wednesday as investors adopt a cautious stance, with Bitcoin consolidating near its short-term support at $77,000. Ethereum remains under pressure, slipping toward $2,400. Ripple is also trending lower.

Diesel’s record $100 warning: The oil shock hiding in plain sight

The Oil market may look calmer than it did a few months ago, but diesel is sending a very different message. The US diesel crack spread, the premium of ultra-low sulphur diesel futures over WTI, recently surged above $100 per barrel for the first time, reaching an intraday record of just over $102.00.