|

NZD/JPY Price Analysis: Negative momentum gains traction, broader outlook still positive

  • The daily chart RSI signals NZD/JPY's shift towards negative momentum.
  • Hourly RSI reveals an oscillating pattern in oversold territory, indicating increasing bearish pressure.

The NZD/JPY declined to 90.95 on Friday, marking a decrease of 1%. Sellers have gained significant ground and hourly indicators indicate oversold conditions which suggests that the pair might sideways trade in the next sessions. As for now, the short term has turned somewhat bearish for the cross as it lost the 20-day Simple Moving Average (SMA).

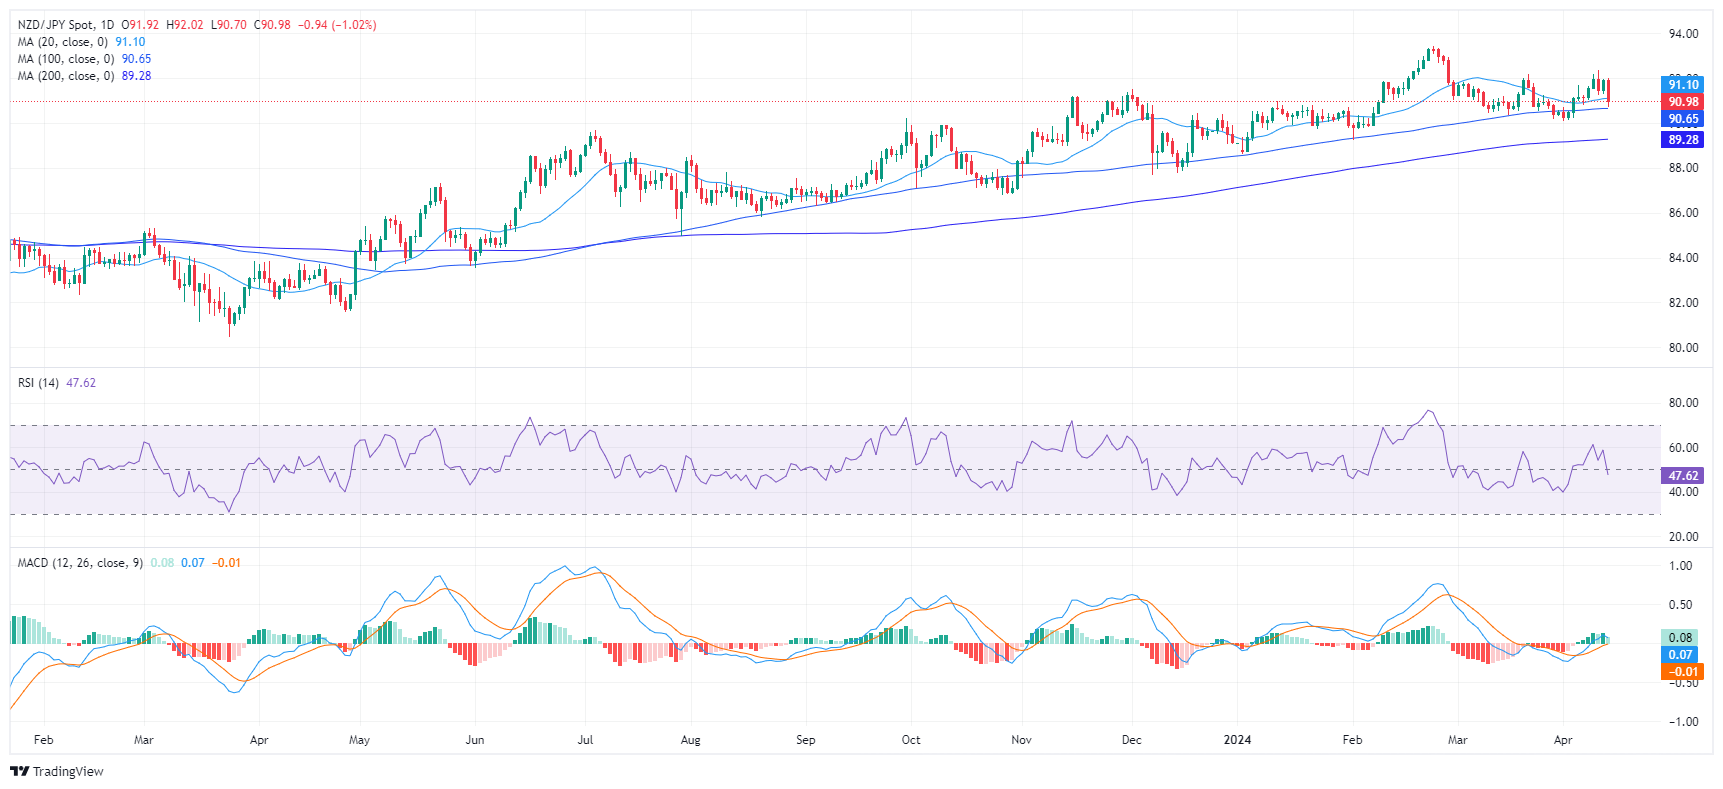
Based on the indicators of the daily chart, the NZD/JPY has pivoted towards a negative momentum. Its Relative Strength Index (RSI) is settling into negative territory, with a last reading of 47. This change indicates that sellers are taking control after a period of positive strength that had the RSI peaking at 63 this week.

NZD/JPY daily chart

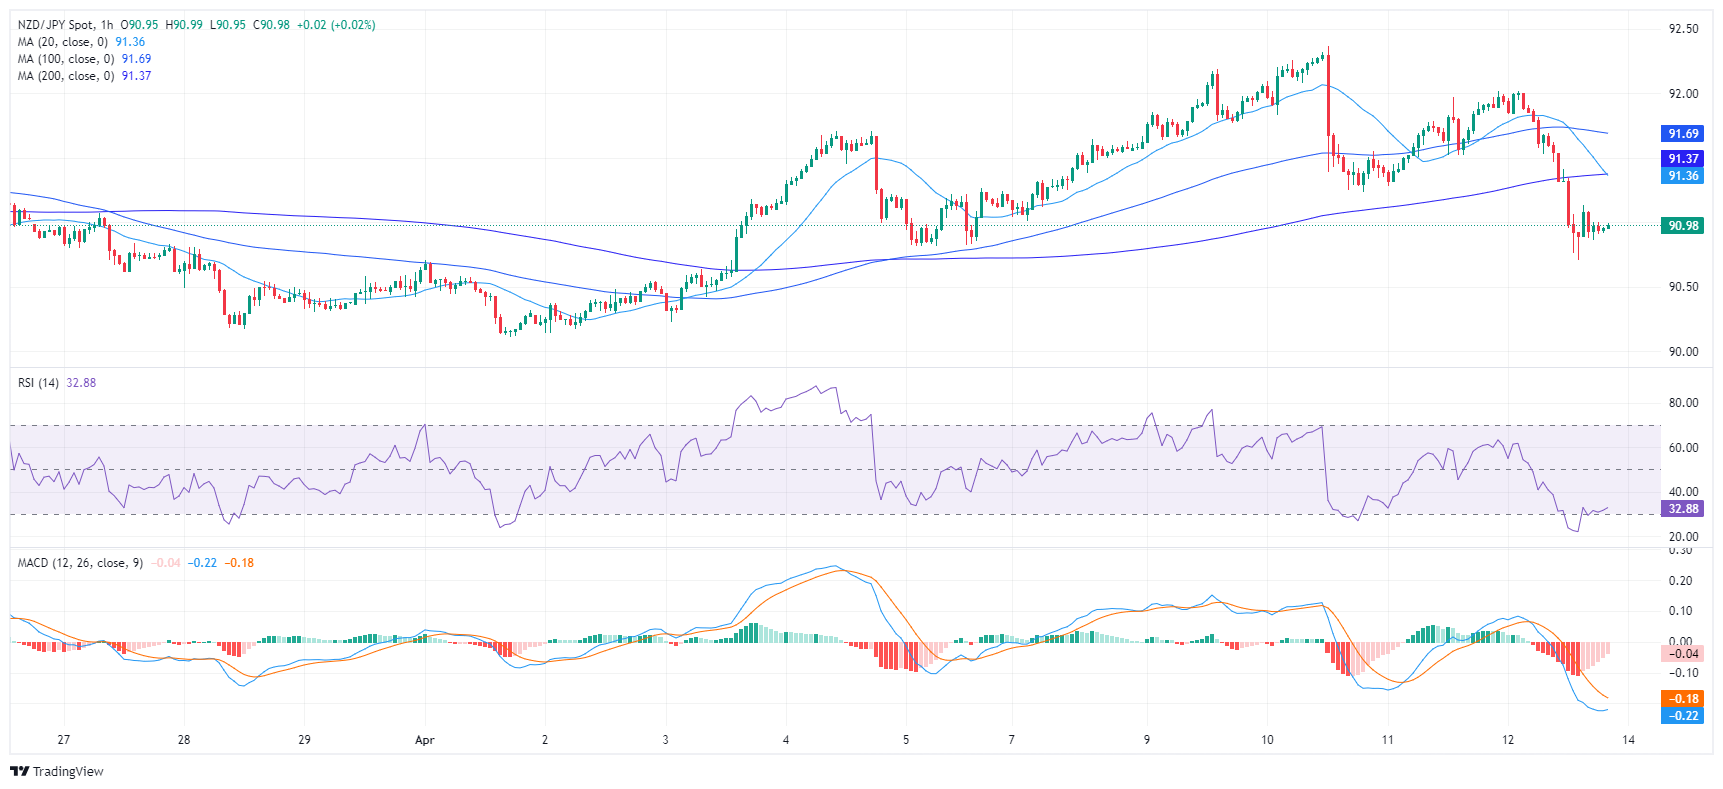
From the hourly chart, the RSI values reveal oversold conditions, with the most recent reading dipping to 30. The Moving Average Convergence Divergence (MACD) histogram generates flat red bars, signaling sustained negative momentum. This coincides with a drop in buyer demand over the past hours, and it could set the tone for the upcoming trading sessions. However, a consolidation shouldn't be ruled out as bears might take a breather.

NZD/JPY hourly chart

In the broader outlook, the NZD/JPY, based on its Simple Moving Average (SMA) still holds a positive outlook as it holds above the 100 and 200-day SMAs. However, the cross, having fallen today below the 20-day SMA, presents a bearish signal for the short term which aligns with the indicators on the daily and hourly chart.

NZD/JPY

Overview
Today last price90.95
Today Daily Change-0.97
Today Daily Change %-1.06
Today daily open91.92
 
Trends
Daily SMA2091.09
Daily SMA5091.35
Daily SMA10090.65
Daily SMA20089.26
 
Levels
Previous Daily High91.97
Previous Daily Low91.28
Previous Weekly High91.7
Previous Weekly Low90.11
Previous Monthly High92.2
Previous Monthly Low90.17
Daily Fibonacci 38.2%91.71
Daily Fibonacci 61.8%91.55
Daily Pivot Point S191.47
Daily Pivot Point S291.03
Daily Pivot Point S390.78
Daily Pivot Point R192.17
Daily Pivot Point R292.42
Daily Pivot Point R392.86

Author

Patricio Martín

Patricio is an economist from Argentina passionate about global finance and understanding the daily movements of the markets.

More from Patricio Martín
Share:

Markets move fast. We move first.

Orange Juice Newsletter brings you expert driven insights - not headlines. Every day on your inbox.

By subscribing you agree to our Terms and conditions.

Editor's Picks

EUR/USD rebounds after falling toward 1.1700

EUR/USD gains traction and trades above 1.1730 in the American session, looking to end the week virtually unchanged. The bullish opening in Wall Street makes it difficult for the US Dollar to preserve its recovery momentum and helps the pair rebound heading into the weekend.

GBP/USD steadies below 1.3400 as traders assess BoE policy outlook

Following Thursday's volatile session, GBP/USD moves sideways below 1.3400 on Friday. Investors reassess the Bank of England's policy oıtlook after the MPC decided to cut the interest rate by 25 bps by a slim margin. Meanwhile, the improving risk mood helps the pair hold its ground.

Gold stays below $4,350, looks to post small weekly gains

Gold struggles to gather recovery momentum and stays below $4,350 in the second half of the day on Friday, as the benchmark 10-year US Treasury bond yield edges higher. Nevertheless, the precious metal remains on track to end the week with modest gains as markets gear up for the holiday season.

Crypto Today: Bitcoin, Ethereum, XRP rebound amid bearish market conditions

Bitcoin (BTC) is edging higher, trading above $88,000 at the time of writing on Monday. Altcoins, including Ethereum (ETH) and Ripple (XRP), are following in BTC’s footsteps, experiencing relief rebounds following a volatile week.

How much can one month of soft inflation change the Fed’s mind?

One month of softer inflation data is rarely enough to shift Federal Reserve policy on its own, but in a market highly sensitive to every data point, even a single reading can reshape expectations. November’s inflation report offered a welcome sign of cooling price pressures. 

XRP rebounds amid ETF inflows and declining retail demand demand

XRP rebounds as bulls target a short-term breakout above $2.00 on Friday. XRP ETFs record the highest inflow since December 8, signaling growing institutional appetite.