Nvidia Stock Price and Forecast: RSI divergence predicts downtrend for NVDA
- Nvidia is dealing with competition from Google.
- NVDA stock chart shows RSI divergence.
- NASDAQ futures drop 0.2% on Thursday.
- Jobless claims suprise to the upside.
Nvidia's (NVDA) stock chart is giving off the whiff of an incoming bearish trend. Based on the last week of trading, NVDA's daily chart bears the unmistakable imprint of a Relative Strength Index (RSI) divergence, which typically precedes a reversal in price action. In this case that would mean a downtrend as Nvdia stock has rallied about 145% off its October 2022 low.
It does not help that Google parent Alphabet (GOOGL) was in the news on Wednesday boasting that its own custom-designed chips are faster than Nvidia's popular A100 chips. That news sent Nvidia stock down 2.1% on Wednesday, while competitor Advanced Micro Devices (AMD) also lost 3.5%.
Nvidia stock news: Google tries to outmanever A100 chip on speed, efficiency
On Wednesday Google said its own fourth-generation Tensor Processing Units (TPUs) were between 20% and 70% fast than Nvidia's comparable A100 chips. Google uses these chips to train its artifical intelligence technology used in its chatbot Bard among other uses. The thing is – Nvidia already has a more powerful chip called the H100, but the A100 is still quite popular among the AI community.
Google also said that these TPUs were nearly twice as efficient on energy use, which may be even a bigger win, since energy use is a note issue among top-performing semiconductors.
And the competition does not stop there. Qualcomm (QCOM) recently reported that its AI 100 chips were better at classifying images and certain other tasks than Nvidia's H100 model.
Jobs, jobs, jobs
The other thing holding back Nvidia stock and other growth stocks is a renewed worry over the US economy. Yes, the Fed's higher interest rates are supposed to bring down inflation via reducing employment, but the market did not expect ADP to report 145,000 new hires on Wednesday. That was well below the 200,000 that were expected. March's nonfarm payrolls report will come out on Friday, but of course the market will be closed then for Good Friday. Those expecting a lighter number will already be exiting their positions here on Thursday.
In the meantime, the jobless claims for the week ending March 31 came in much higher than expected on Thursday morning. They were 228,000 compared with consensus for 200K. The market is reading this as a sign that the economy is beginning to turn lower.
As it stands, Wall Street consensus is expecting March's nonfarm payrolls figure to come in at 240K, well below the 311K reported for February.
Nvidia stock forecast
Nvidia stock's higher lows between March 28 and April 5 can be seen below moving on an upward trajectory. However, the same movement on the RSI at the bottom of the chart shows a descending angle over that time period. The low of each session is connected with a pink line.
This RSI divergence should mean that NVDA shares begin a reversal pattern. The first sign will be a drop below the April 2022 support level at $260. From there bears will likely push to the volume spread around $240, but if the pullback has legs, then expect to see March's $225 support level in the cards.
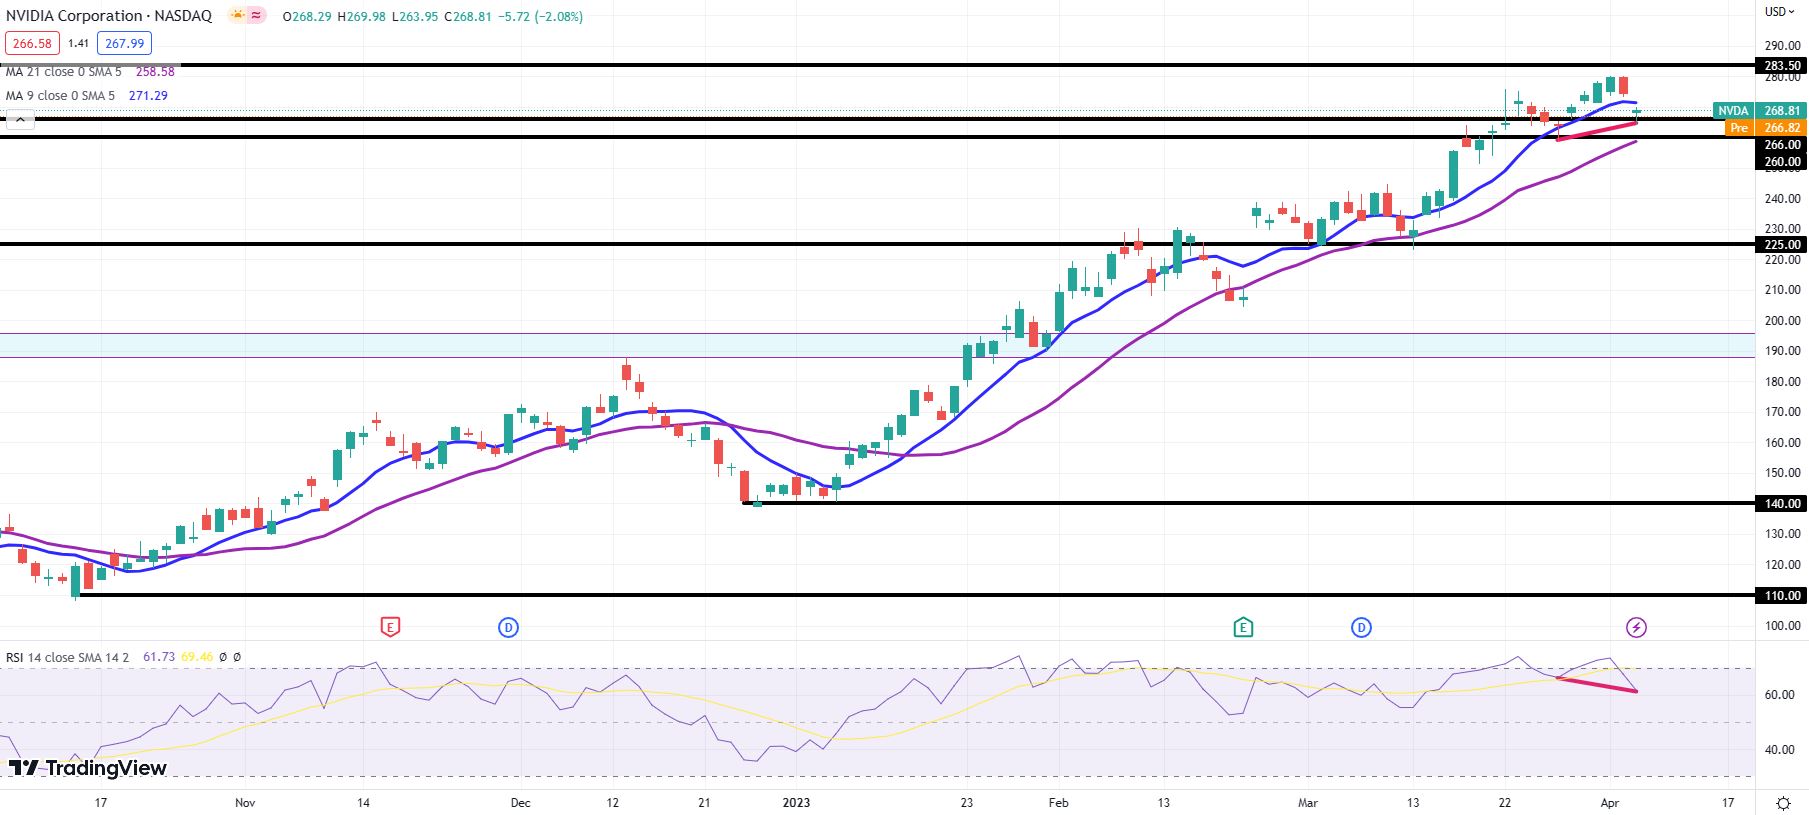
NVDA daily chart
Author

Clay Webster
FXStreet
Clay Webster grew up in the US outside Buffalo, New York and Lancaster, Pennsylvania. He began investing after college following the 2008 financial crisis.

















