NVDA: The chart setup hiding behind the bond-sale headlines
The setup nobody’s watching while everyone argues about the bond sale
The noise around Nvidia this week is the $25 billion bond offering and another round of “is the AI trade overheating” think pieces. The chart is telling a quieter, more useful story. After the early-June chip-sector flush dragged NVDA from its highs near $236 down toward the $200 region, price has spent the last two weeks doing something specific: it stopped falling exactly where it was supposed to.
That “where it was supposed to” is the whole point of today’s chart.
Two levels did the work
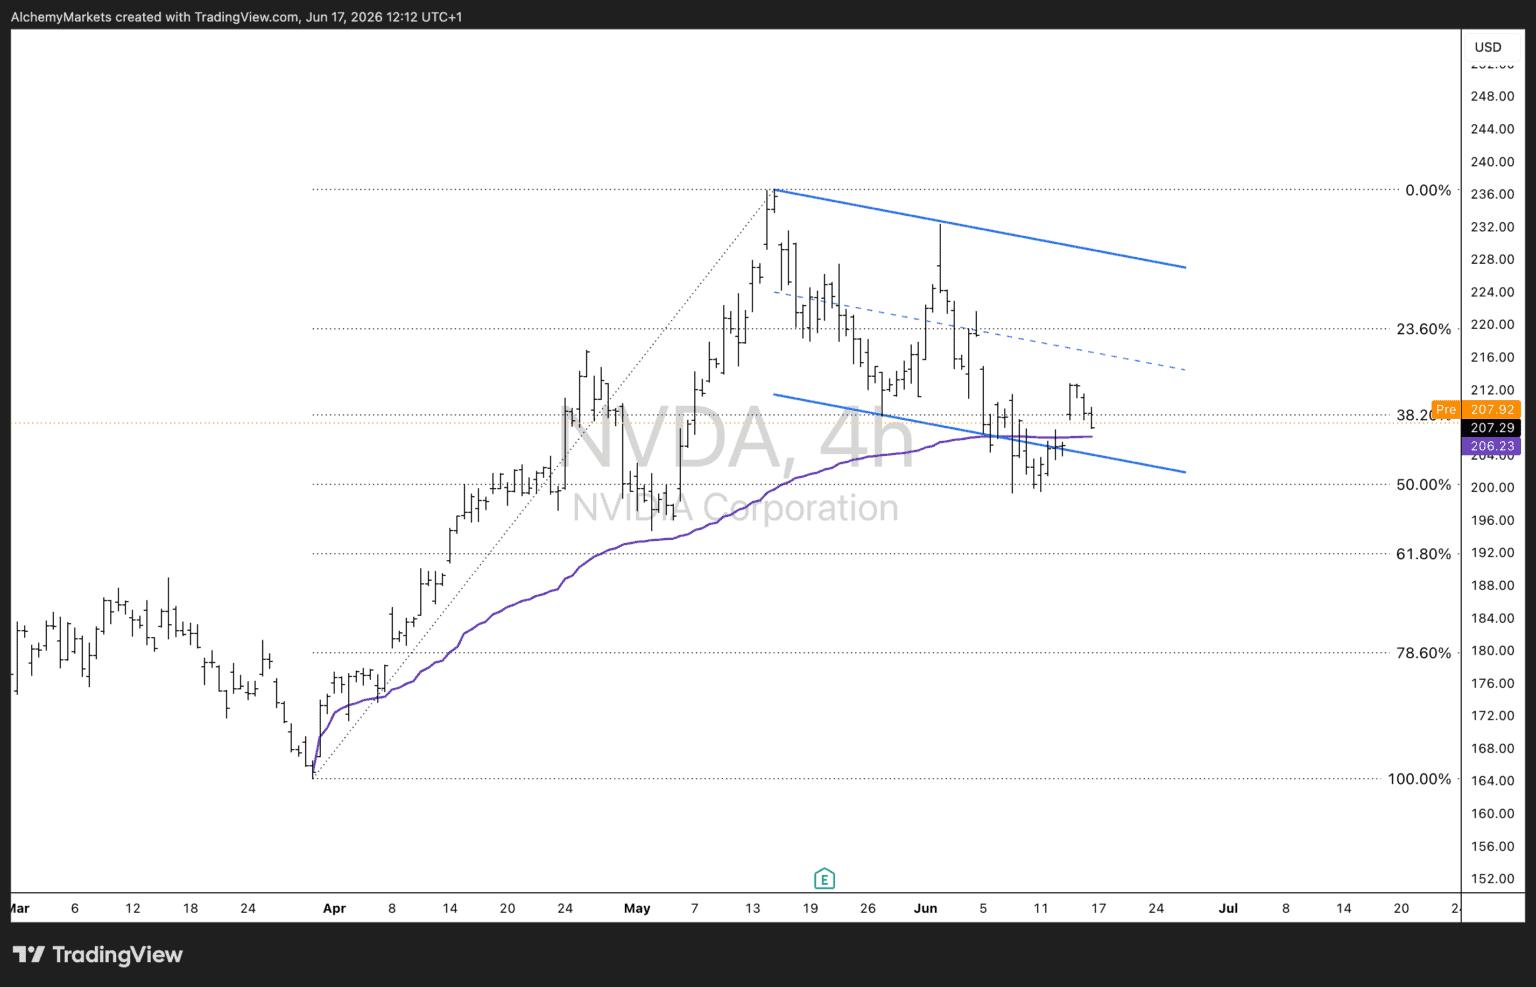
The bounce off the recent lows lines up with a pair of references that traders watch closely. The first is the 50% Fibonacci retracement of the entire March-to-May advance, the rally that ran from the $164 base up to the $236 peak. The midpoint of a move is where buyers and sellers often re-test conviction, and price found a floor right in that zone before turning back up.
The second is the anchored VWAP measured from the March lows. That line tracks the average price paid by everyone who bought into this leg higher, and it has flattened out and acted as support right where price stabilised. When a 50% retracement and a major VWAP sit on top of each other, you get confluence, and confluence is what turns a random bounce into a level worth respecting.
The shape that’s forming
Zoom into the recent action and the structure resembles a bull flag. The sharp run into the highs was the pole, and the gentle, downward-drifting consolidation since then is the flag, drawn here by the two descending blue trendlines. Bull flags are continuation patterns, meaning they typically resolve in the direction of the move that preceded them. Price is currently pressing against the upper boundary of that flag near the 38.2% retracement, with the pre-market print around $207 to $208.
What actually powers the next leg
A flag is just a pattern until something fundamental pushes price through it. For Nvidia, that something has a name: hyperscaler capex. The chart below is the spending pipeline that Nvidia is ultimately priced on.
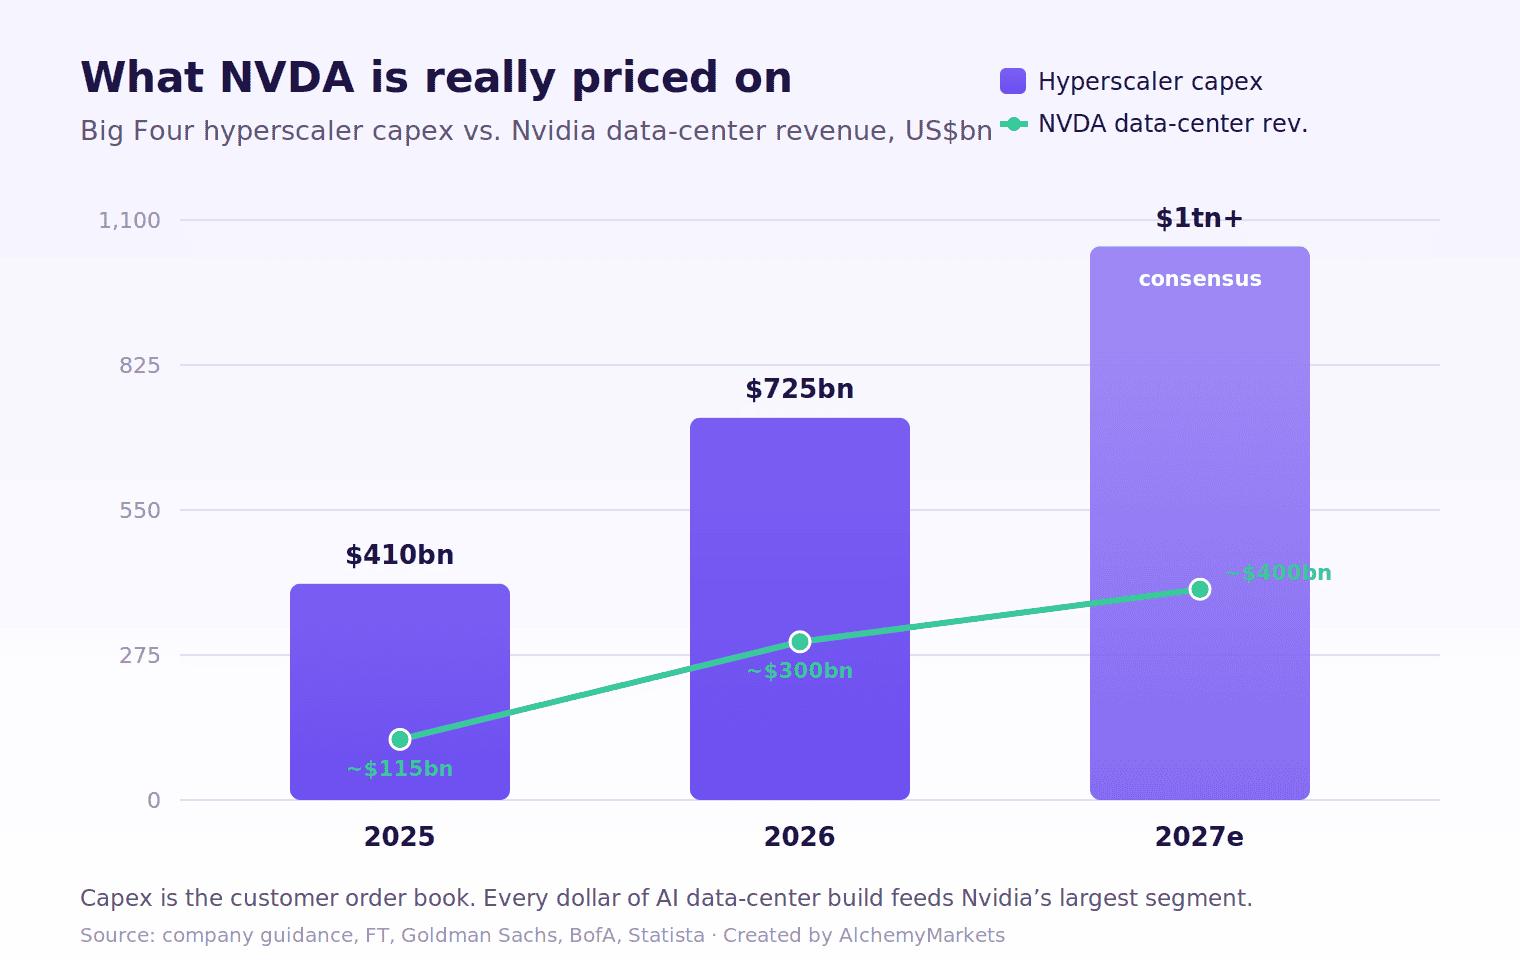
The four largest cloud builders, Microsoft, Alphabet, Amazon and Meta, are lifting combined capital spending from roughly $410 billion in 2025 to about $725 billion this year, with Wall Street consensus now placing 2027 above $1 trillion. The bulk of that money flows into AI data centres, and the single biggest beneficiary of that build is Nvidia’s data-center segment, the mint line riding on top of the bars. Put simply, the bars are the order book and the line is the revenue it produces. As long as that pipeline keeps expanding, the technical dips have a fundamental floor underneath them.
What turns this from idea into trade
The pattern is not confirmed yet. A bull flag only counts once price breaks and holds above the upper trendline of the flag, ideally on a pickup in volume. Until that happens, this is a stock balancing on support rather than launching off it.
The two things to watch are simple. On the upside, a clean break above the flag’s upper edge and the 38.2% level opens the path back toward the recent swing highs and the gap up to the 23.6% zone. On the downside, a decisive close back below the anchored VWAP and the 50% retracement would invalidate the bounce and put the lower $200s, then the $196 region, back in play.
For now, the bulls have the better argument. Confluence support is holding, the consolidation is tightening, and the spending backdrop that feeds Nvidia’s largest segment is still climbing. The chart has done its part. The market just needs to confirm it.
Author

Zorrays Junaid
Alchemy Markets
Zorrays Junaid has extensive combined experience in the financial markets as a portfolio manager and trading coach. More recently, he is an Analyst with Alchemy Markets, and has contributed to DailyFX and Elliott Wave Forecast in the past.


