NQ100 testing highs again after 1st choppy retracement

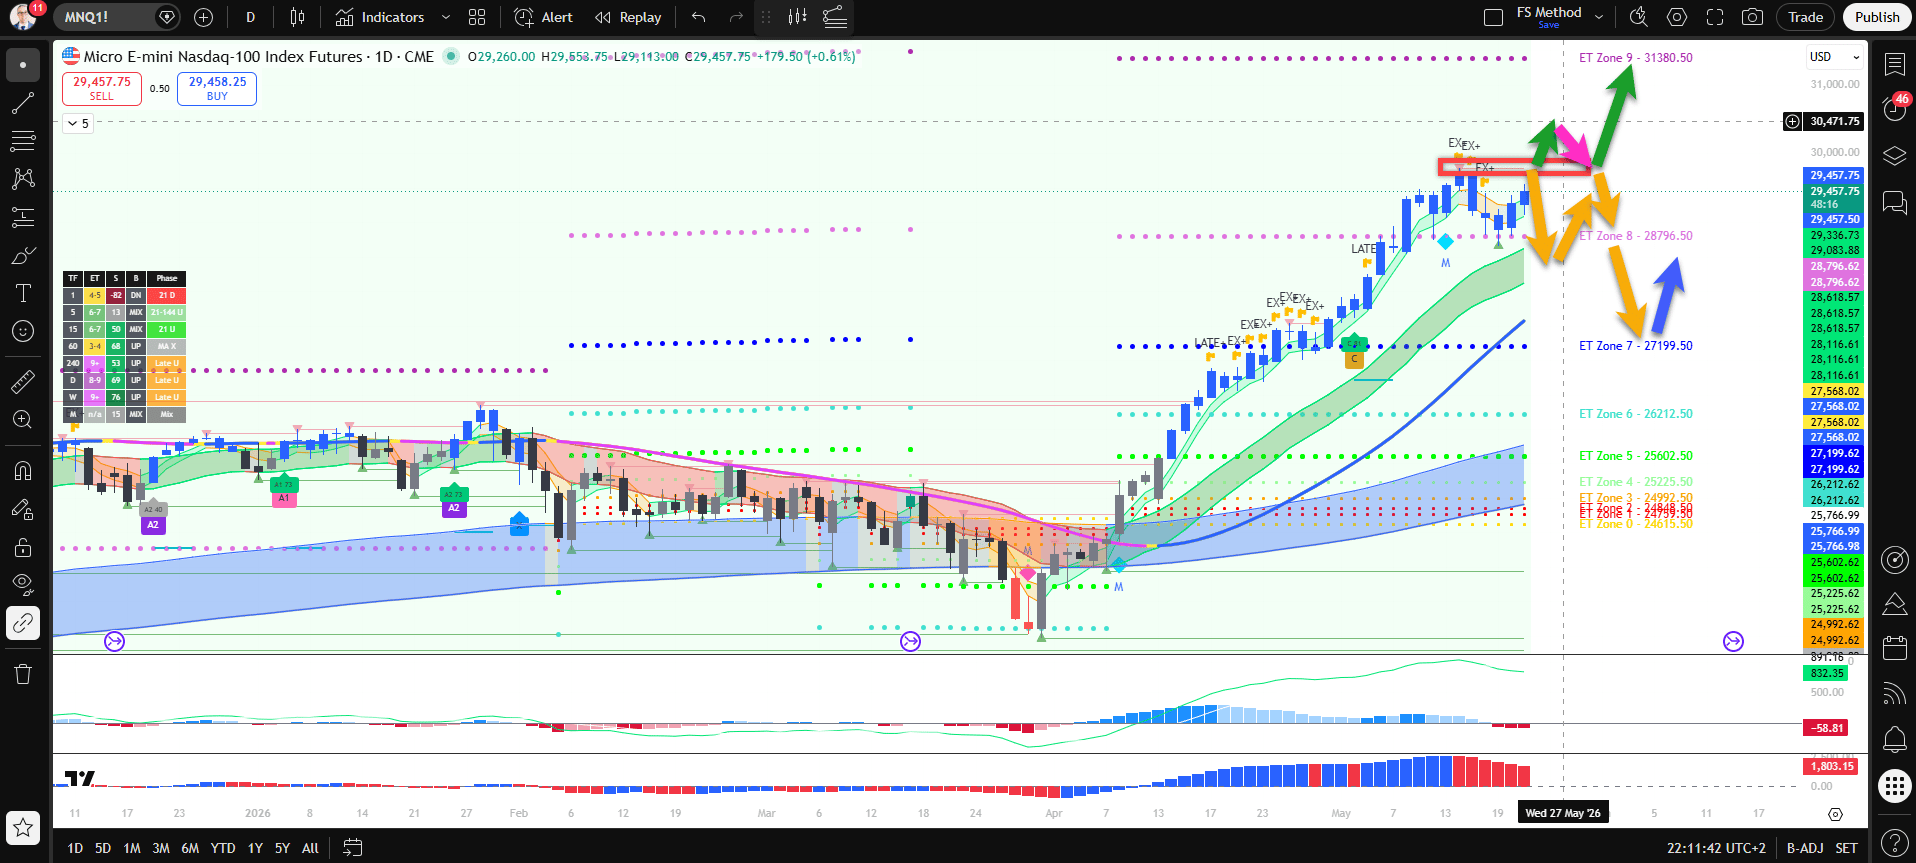
The Nasdaq (NQ100) has been slowly correcting lower since reaching an all-time high (ATH) on May 14. Price has declined 1000 points before eventually finding new buyers. But the uptrend continuation seems to be slowing day on the daily chart
Daily chart
5 days without a higher high
Price action has failed to break the high for five days in a row. This is a warning signal that the uptrend is losing steam. The 6th day – tomorrow on Friday 22 May – could be crucial candlestick for understanding whether price will trend higher or retrace lower.
Let’s review the main scenarios:
1. If tomorrow’s daily candlestick is bearish: we expect the uptrend then to be temporarily over and a larger bearish retracement to take place (orange arrow).
2. Price action would at first decline towards the 21 ema zone (green shade), but a larger retracement to the 144-233 ema zone (blue shade) could take place once there is a 2nd bearish break below ET zone 8.
3. A bullish breakout could extend the uptrend (green arrows).
4. However, price action would need to stay above the highs (red box) to ensure that the breakout is not the end of the trend. A sideways pattern (pink arrow) is required to confirm the upside continuation towards the target at ET zone 9.
5. The main scenario is that price action will become choppier or more bearish because often price action consolidates or reverses after hitting ET zone 8. No often do we see price action moving up in one arrow to ET zone 9.
1 hour chart
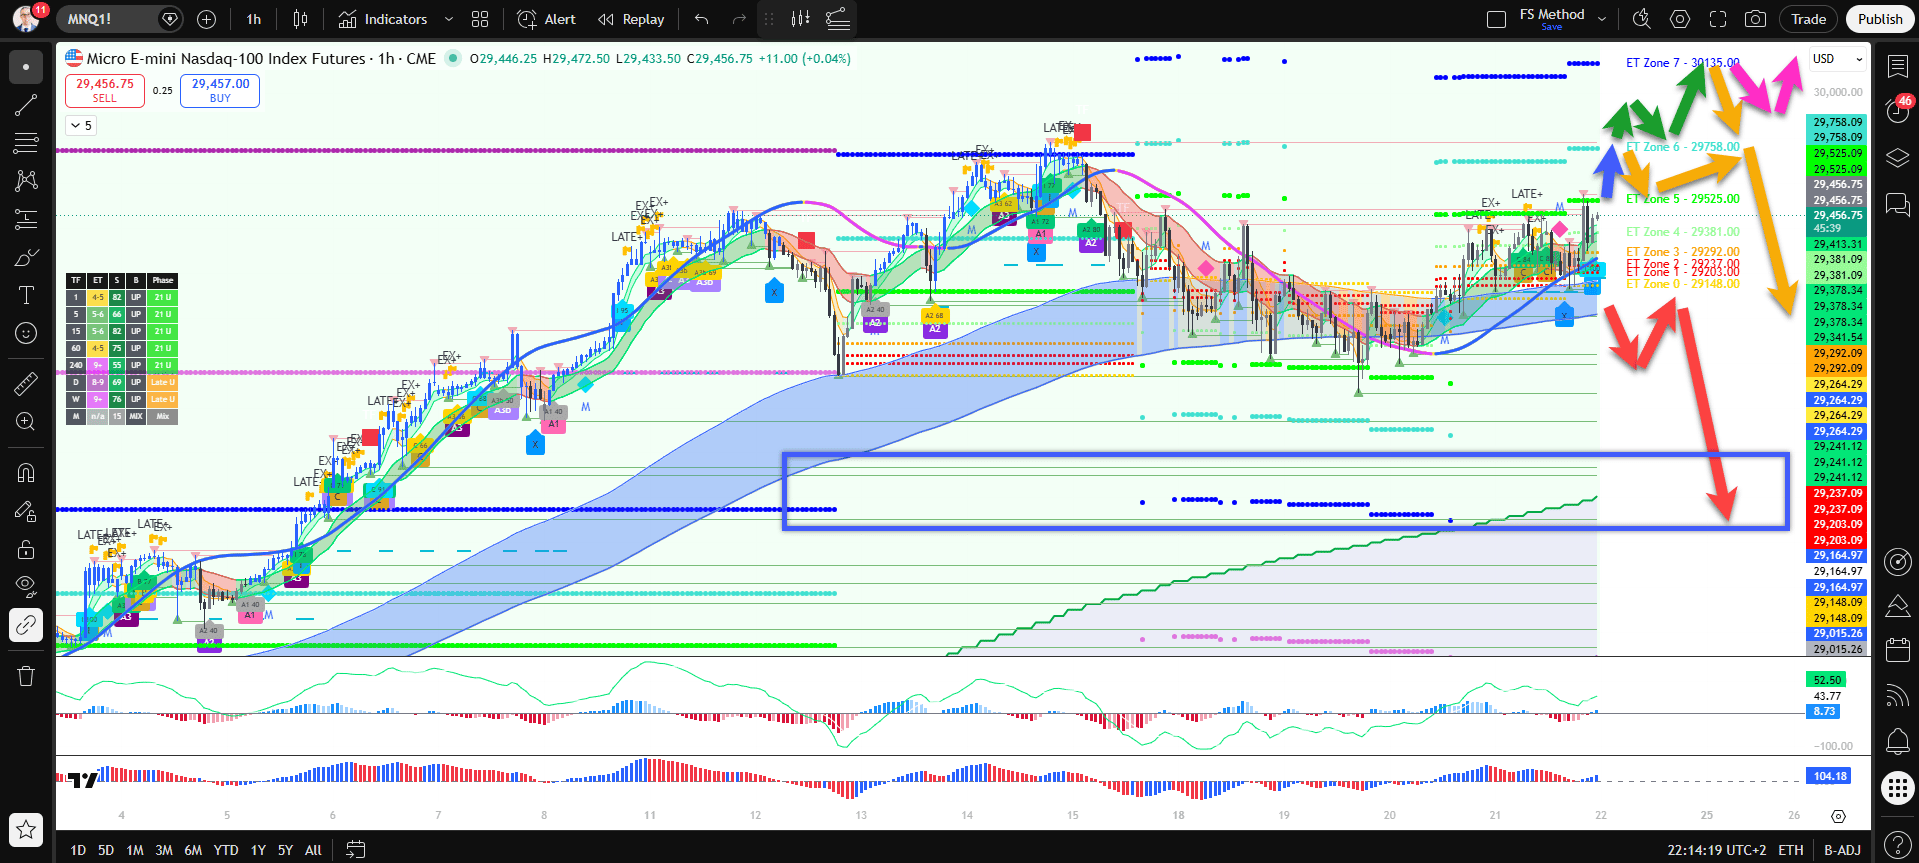
Testing ET zone 5 on 1 hour chart
The 1 hour chart is testing a critical ET5 zone. A bearish bounce could indicate the temporary end of the uptrend.
Let’s analyse the path of least resistance:
1. A bearish breakout below the 144-233 ema zone could indicate a larger bearish retracement (red arrows) down the long-term moving average zone (green shared Mas)
2. A bullish breakout (green arrow) could test the previous top and ET zone 6 (blue arrow).
3. A breakout above the ET zone 6 might see price action confirm an uptrend (green arrows).
4. Only a continuation pattern above ET zone 5-6 could see a larger uptrend on the daily chart (pink arrows).
5. ET zone 6 could act as a resistance spot for a larger bearish correction (orange arrows).
These are the key decision zones at the moment. We will need to see how price action responds to each level to get a sense of the next sizeable move. For the moment though, Friday’s daily candlestick could be an interesting one to keep an eye on.
Wishing you good trading!
Author

Chris Svorcik
FS method
Chris Svorcik is a trader, analyst, and educator with over 15 years of experience in financial markets, specializing in moving averages, market structure, and price patterns.

















