|

NQ100 strong 1000 points bearish pullback coming soon

The Nasdaq (NQ100) has shown an impressive bullish impulse since the beginning of April 2026. In just 6 weeks, the NQ100 climbed from 24,750 to almost 29,500 for an approximate gain of 19%. Impressive. Now the main question is: can the NQ100 extend those gains? Let’s review it.

Daily chart
NQ

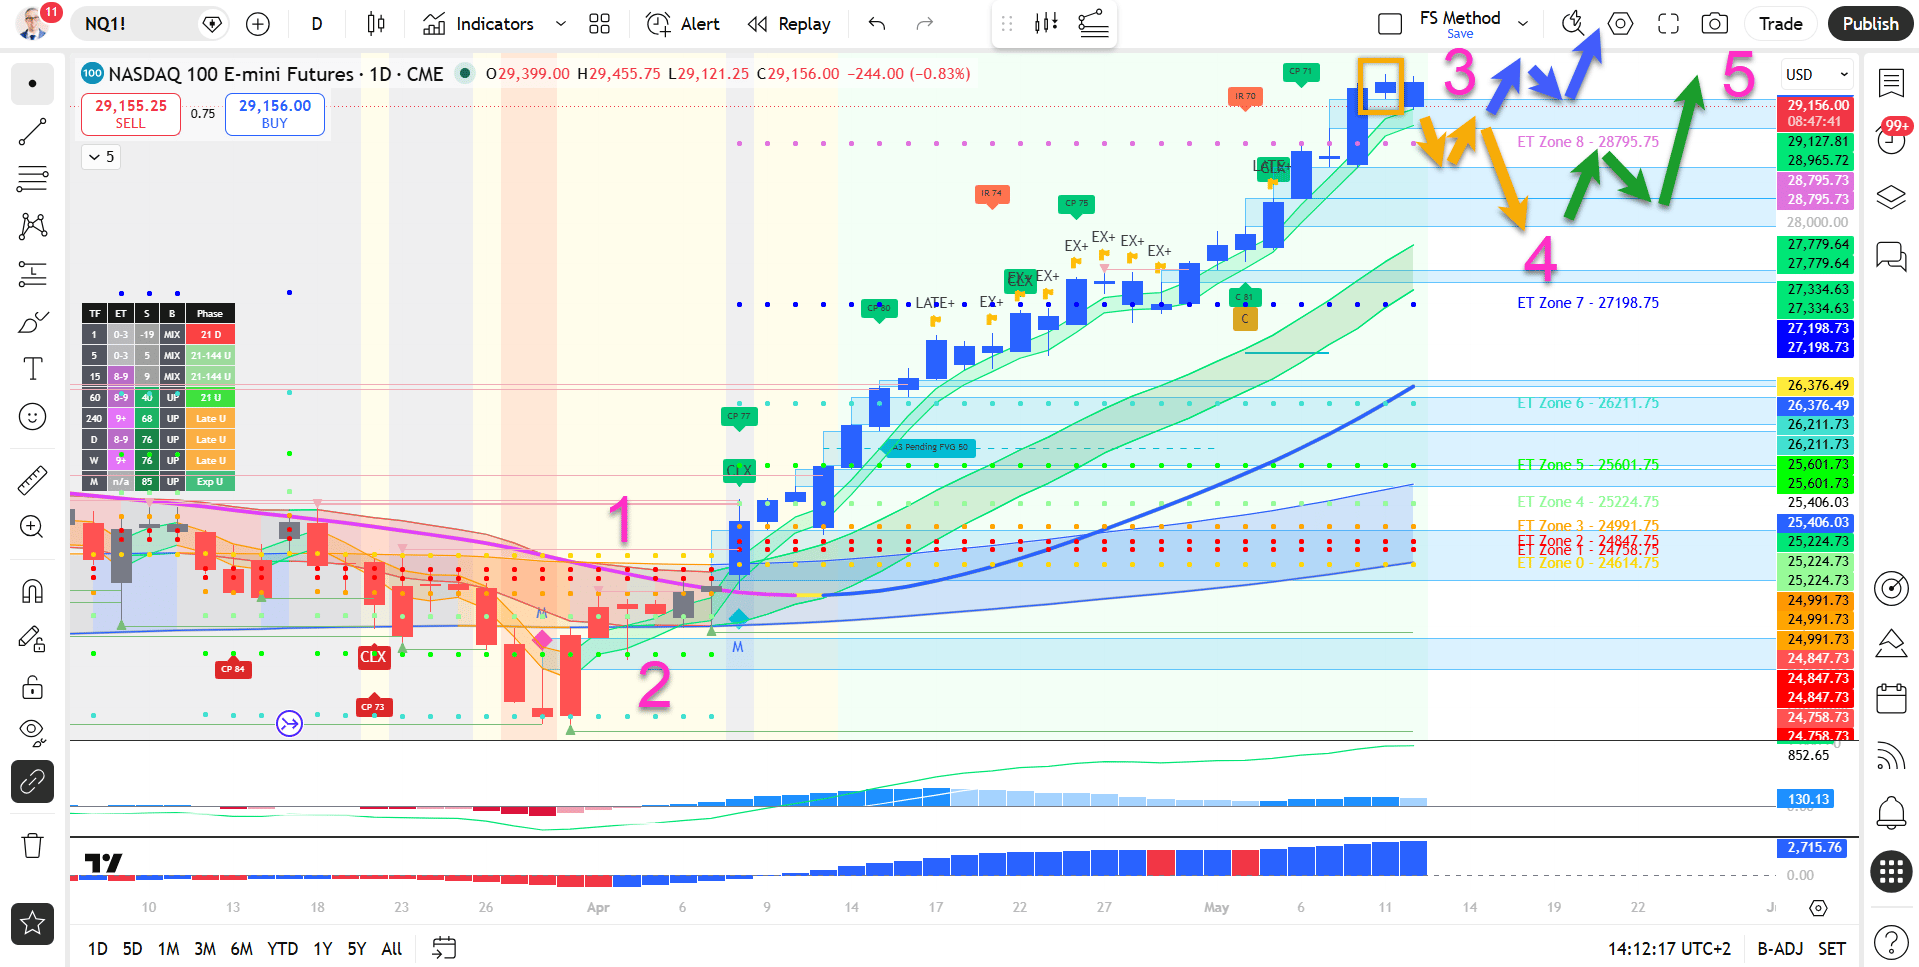
Break below Monday’s low

Price action is making a bearish pullback at the moment. The break below Monday’s low (orange box) is confirming a retest of the ET zone 8.

Let’s review the main scenarios:

  • A bearish break, pullback, and decline is the main expected scenario for the upcoming 1-2 weeks (orange arrows).
  • The bearish retracement could see price fall towards the support around 28,000-28,250, which is aligned with the 21 ema zone of the daily chart.
  • An uptrend continuation and a new higher high (green arrows) within a wave 345 (pink) is expected considering the strong bullish impulse since the start of April.
  • An immediate bullish uptrend might be possible but this scenario would only make sense after price bounces at the 21 ema, breaks through resistance, and rallies (blue arrows).

Four-hour chart
NQ

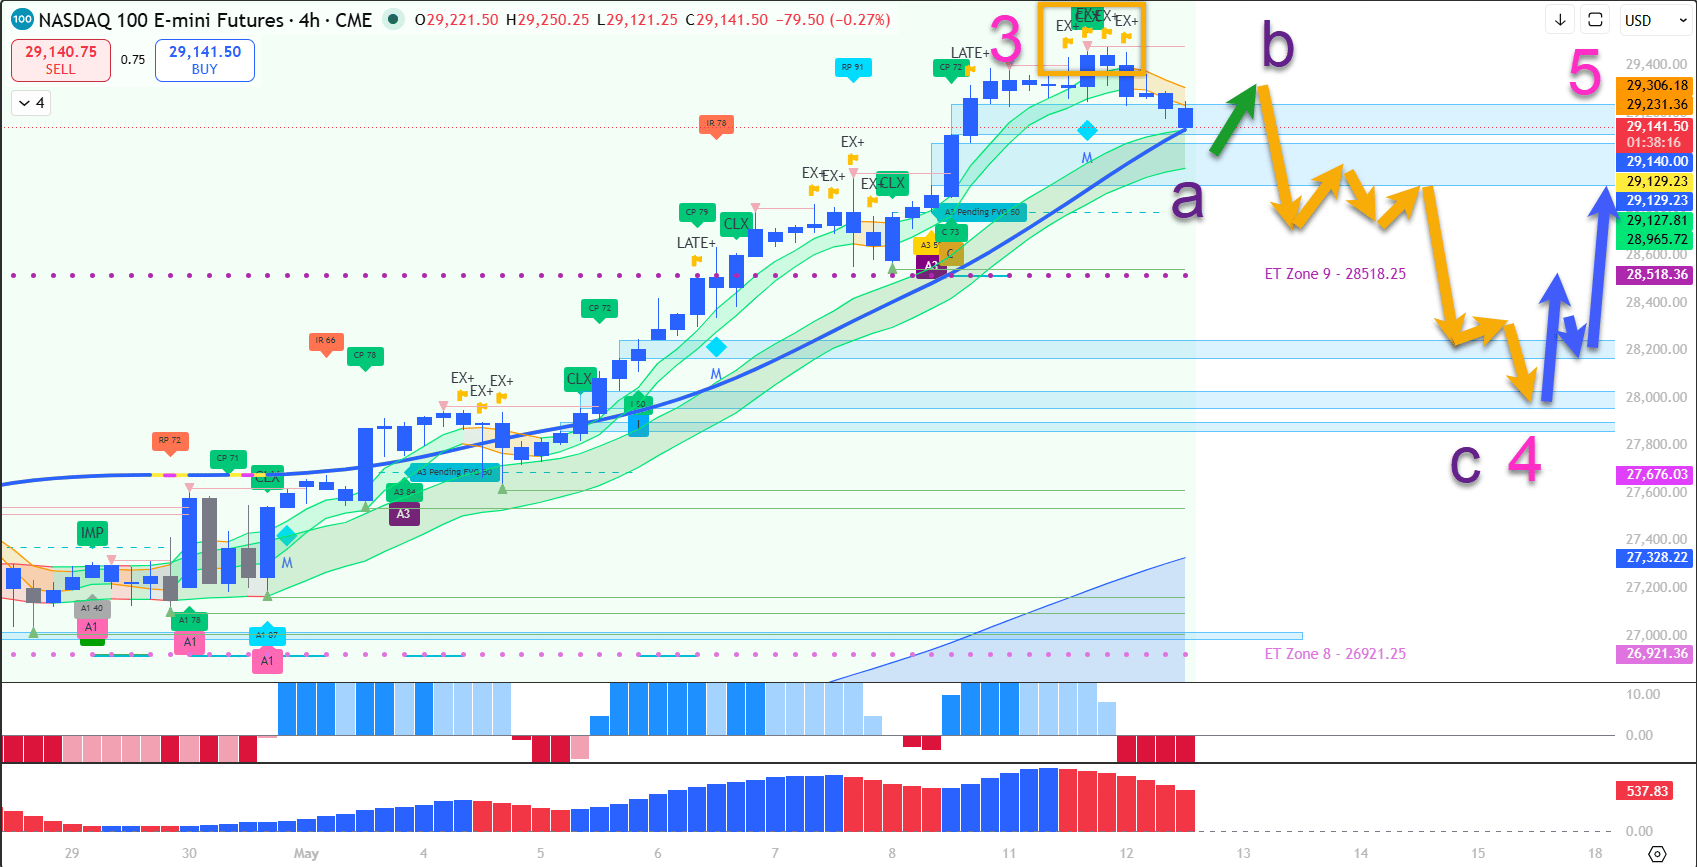
Retest 21 EMA after exhaustion signals

The four-hour chart showed signs of exhaustion according to our template (orange box). The EX signs above the 4 candles show loss of momentum before price action started to make a bearish pullback.

Let’s analyse the path of least resistance:

  • Price action is testing the 21 ema zone, which is a key decision zone.
  • A bullish bounce is expected (green arrow).
  • But a larger bearish pullback should take price action back to the 144 ema (orange arrows).
  • An ABC (purple) pattern is expected within wave 4 (pink).
  • Once price completes the correction, a continuation of the uptrend could see price move higher for a wave 5 (pink) and a new higher high (blue arrow).

An uptrend continuation remains likely as long as price action remains above the 144-233 ema zone on the 4 hour chart.

Author

Chris Svorcik

Chris Svorcik

FS method

Chris Svorcik is a trader, analyst, and educator with over 15 years of experience in financial markets, specializing in moving averages, market structure, and price patterns.


More from Chris Svorcik
Share:

Editor's Picks

GBP/USD clings to gains near 1.3650 after mixed UK data

GBP/USD trades in positive territory at around 1.3650 in the European session on Friday as the upbeat PMI data supports Pound Sterling despite disappointing Retail Sales figures. Meanwhile, the US Dollar (USD) struggles to stay resilient against its peers following the Treasury Department's decision to boost long-term bond purchases earlier in the week, helping the pair hold its ground ahead of US PMI data.

EUR/USD holds near 1.1700 ahead of US PMI data

EUR/USD consolidates its weekly gains at around 1.1700 in the European session on Friday following the mixed PMI prints from Germany and the Eurozone. Investors await preliminary August PMI surveys for the US, while the persistent USD weakness allows the pair to keep its footing.

Gold hits fresh high since June above $4,550 as receding Fed hike bets undermine USD

Gold sticks to modest gains near its highest level since early June, touched earlier this Friday, and trades just above $4,550 heading into the European session. The commodity is looking to build on the breakout momentum above a technically significant 200-day Simple Moving Average amid a weaker US Dollar. Traders scaled back their bets on an immediate interest rate hike by the Fed after the latest US inflation data released last week signaled signs of cooling price pressures.

Bulls in control with Bitcoin heading toward $80,000, Ethereum $2,500, XRP $1.50
Bitcoin (BTC), Ethereum (ETH) and Ripple (XRP) are extending their rallies as bullish momentum strengthens and continue to cheer the US Treasury’s decision to double its debt buyback operations. BTC has climbed nearly 20%, ETH over 25% and XRP nearly 30% so far this week.
The great bond-market repricing: Why deficits, geopolitics and AI are driving long-term yields higher

The biggest move in financial markets right now may be happening in an asset class that many equity and FX investors rarely watch closely: government bonds. Long-term yields have surged across the US, Europe, the UK and Japan, with several benchmarks reaching levels not seen for more than a decade.

$20 billion offered, $2 billion taken: Why Treasury doubled its buyback cap

The US Treasury moved off its own calendar on Wednesday, and that is the part worth sitting with. At 12:32 GMT, the department said it would at least double the size of liquidity support buyback operations in the 10-year to 20-year and 20-year to 30-year sectors, lifting the maximum from $2 billion per operation to at least $4 billion, effective September 9 and running to November 4.














