|

NQ 100 impulsive price action likely to continue

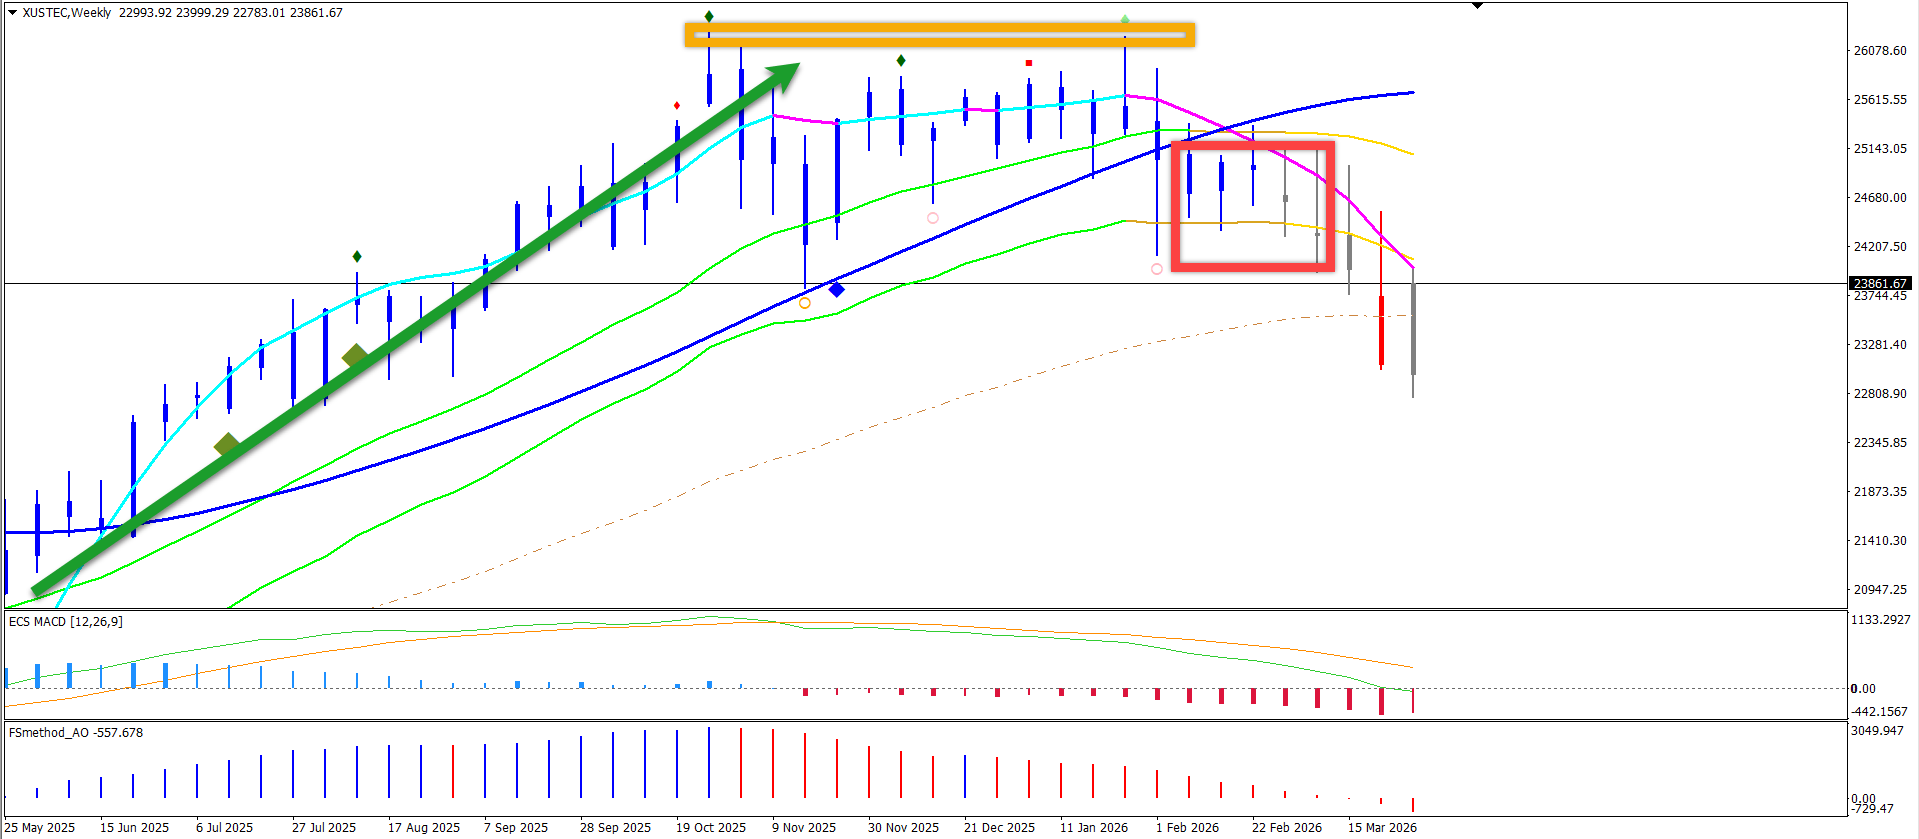
The Nasdaq has been in a roller-coaster ride during the past three weeks. It was going sideways for a couple weeks (Doji candles in rex box) after a double top (orange box) indicated a pause in the huge uptrend (green arrow).

Weekly chart

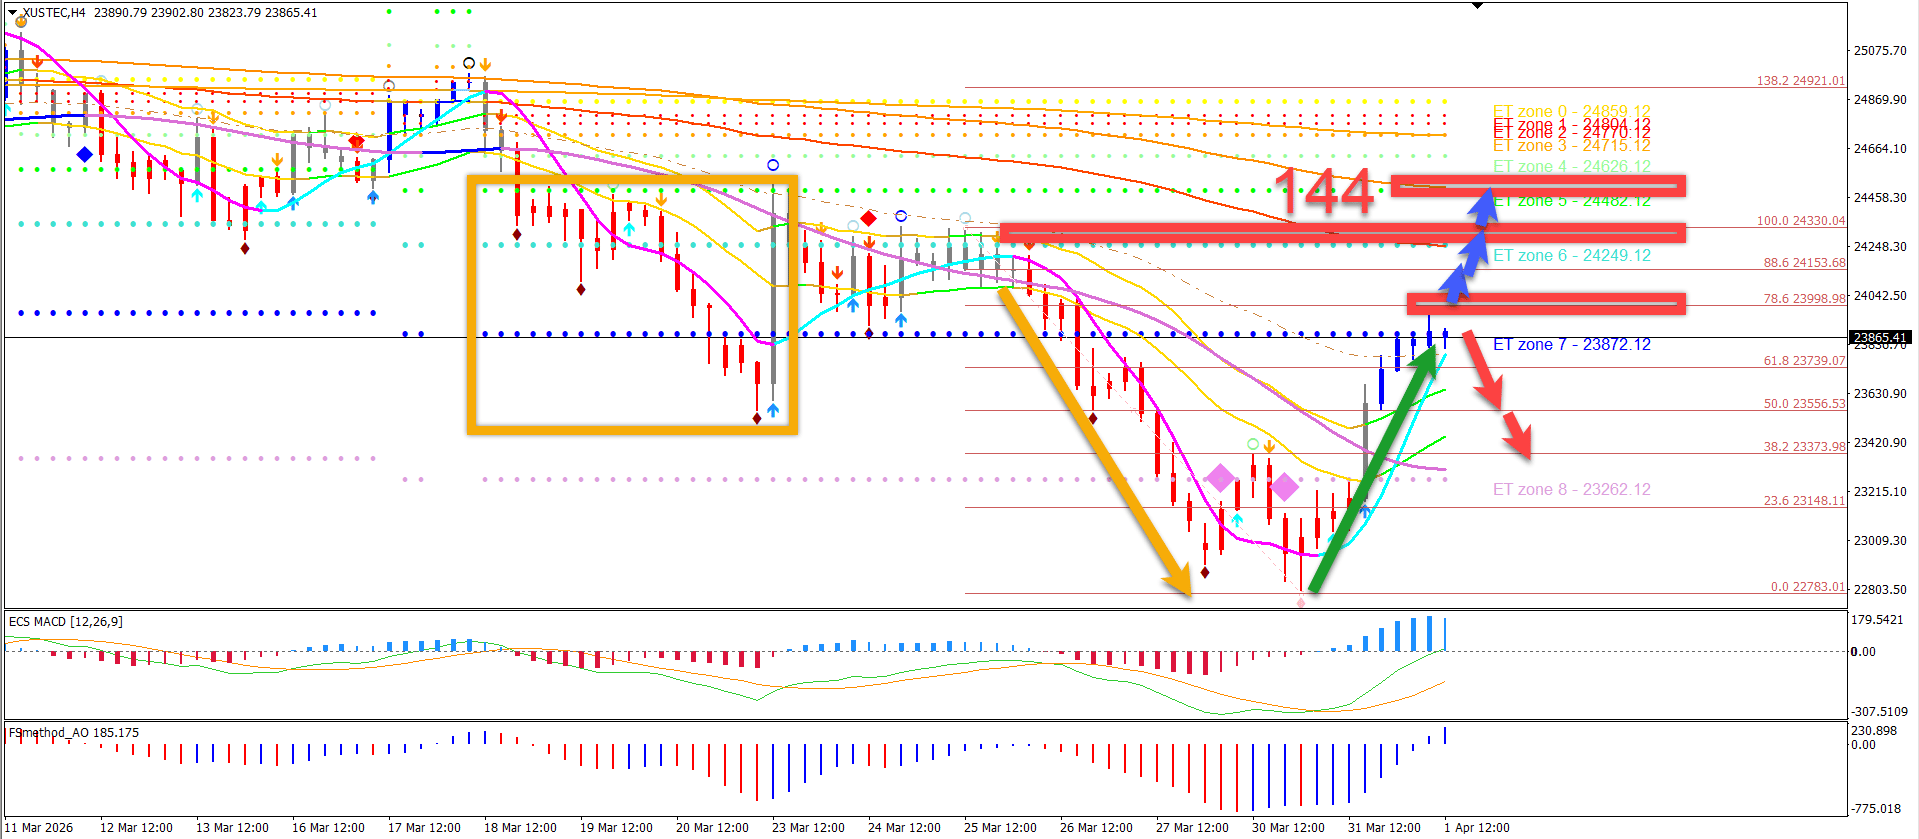
Momentum up after bearish breakout

The ET zone indicator shows how far price has moved away from the 144 ema long-term average. Price made an initial breakout below the range and ET zone 7 (orange box) followed by a continuation below ET zone 8 (orange arrow).

The bullish price action has retraced large parts of the decline (green arrow) but price action is approaching heavy resistance levels (red boxes). There are two main scenarios:

1)  Blue arrows: A bullish breakout above the resistance could see further intra-day gains towards higher highs. The bullish momentum would be primarily interesting on lower time frames as the space higher is tight and the probability of a bearish retracement increases.

2)  Red arrows: A bearish bounce could confirm the retracement at the 78.6% Fibonacci level. Price could retest the 21 ema zone which would be a key bounce or break spot. A break below 21 ema support could indicate an extension lower whereas a bounce indicates a larger reversal towards the 144 ema zone.

Four-hour chart

Chart

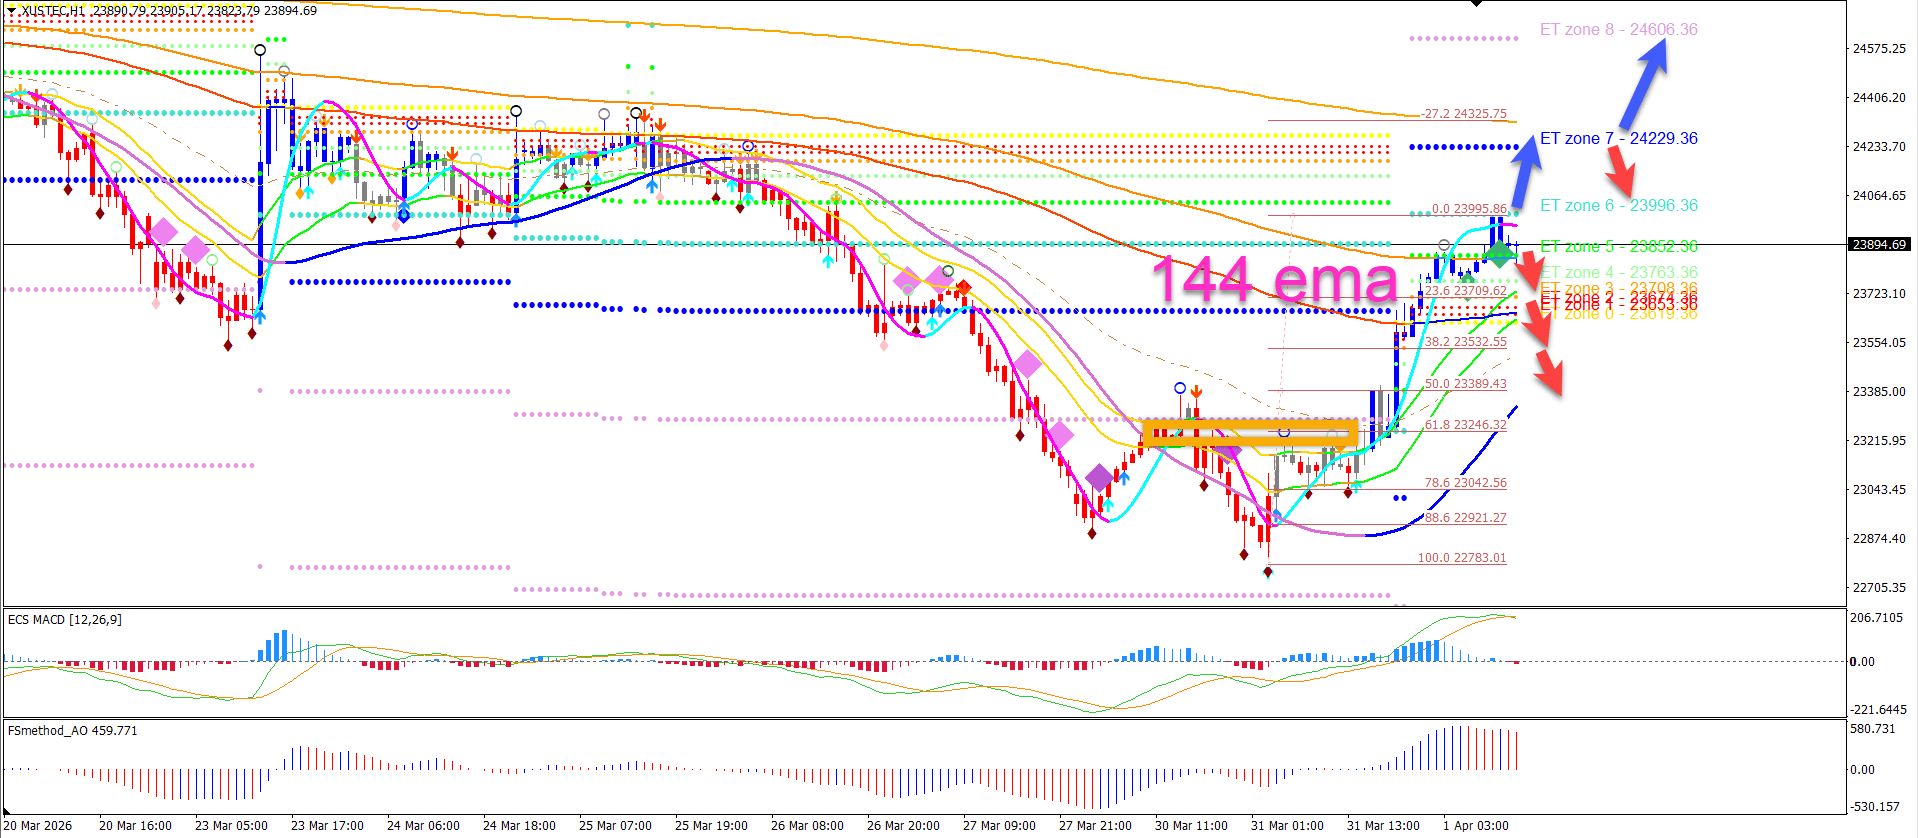
Key moments on one-hour chart

Price moved up 1300 points in a matter of hours. The bullish breakout above the fractals and 21 ema zone (orange box) indicating the reversal. Price has recently hit the ET zone 6 above the 144 ema zone, which is key level for the reversal.

1)  Bullish break: A bull break gives potential space to ET zones 7 and 8 (blue arrows).

2)  Bearish bounce: A bearish bounce gives potential space lower toward the Fibonacci retracement support levels (red arrows).

One-hour chart

Author

Chris Svorcik

Chris Svorcik

FS method

Chris Svorcik is a trader, analyst, and educator with over 15 years of experience in financial markets, specializing in moving averages, market structure, and price patterns.

More from Chris Svorcik
Share:

Editor's Picks

AUD/USD stays bid above 0.7100 on Australian trade data, Mideast optimism

AUD/USD clings to minor recovery gains above 0.7100 in the Asian session on Thursday as a new Israel-Lebanon ceasefire keeps a lid on the safe-haven US Dollar. Meanwhile, strong AustralianTrade Balane data also help the Aussie pair sustain the bounce from weekly lows.

USD/JPY hovers near the 160.00 intervention threshold on Mideast tensions

USD/JPY struggles to find acceptance above 160.00 and retreats from a one-month high in the Asian session on Thursday amid fears that authorities will step in again to prop up the Japanese Yen. Furthermore, a new Israel-Lebanon ceasefire caps the US Dollar and supports the currency pair. However, renewed US-Iran tensions keep the downside limited in the Greenback and the pair.

Gold rebounds from one-week low as Israel-Lebanon truce pressures safe-haven USD

Gold gains some positive traction on Thursday and climbs to the $4,475 area during the Asian session, reversing a major part of the previous day's slide to a one-week low. The Israel-Lebanon truce prompts some profit-taking around the US Dollar and supports the commodity. 


Ethereum: Long-term holders' capitulation drives ETH below $1,800

Ethereum has fallen below $1,800 on Wednesday, the first time since May 2025 following accelerated spot selling pressure and distributions from long-term holders. The Age Consumed metric, which tracks the movement of previously idle tokens or long-term holders' coins, spiked over the past two days as prices declined, indicating increased selling activity among this cohort.

Kevin Warsh takes the Fed helm: What it means for the US Dollar
The Federal Reserve moves away from the highly predictable "forward guidance" model of the Jerome Powell era to a new “Kevin Warsh environment”, characterized by less communication, more policy surprises, and an increased focus on the Fed's complex balance sheet.
Recession on paper: What really moves the Canadian Loonie now?

Statistics Canada handed the headline writers a gift and the analysts a headache. Real GDP shrank 0.1% on an annualized basis in the first quarter, and with the fourth quarter of 2025 revised down to a 1.0% contraction, that is two negative quarters in a row, the textbook definition of a technical recession and Canada's first since the pandemic.