Novo Nordisk's recovery hits the level that broke the stock: $47 decides

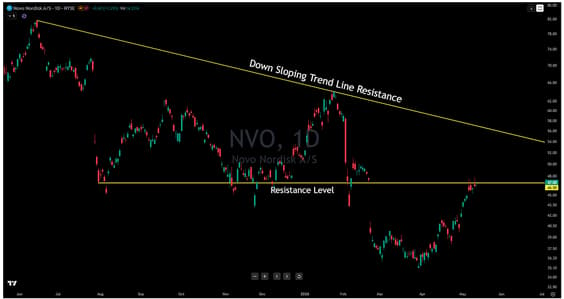
The chart on Novo Nordisk A/S (NVO) is back at the line that ended last year's rally. Price has run from the early-April low at $35.10 to $46.90 today, up 1.29% on roughly 14.25 million shares, and is now pressing into the $47 horizontal resistance that has capped this stock since the winter breakdown.
Novo Nordisk reported Q1 2026 results in early May showing adjusted sales down 4% at constant currencies, but the market shrugged it off. Shares rose on the report, and the stock has been recovering since. The recovery has done the easy part. Clearing $47 is what makes it a trend.
Look at where $47 came from. Through late summer and into the fall of 2025, $47 was the level price kept defending. Every pullback into that zone got bought, every bounce launched off it, and the stock used it as the floor for the back half of the year. Then the early-2026 collapse blew through it on a single heavy bar, and what had been the floor flipped into the ceiling. That is the standard polarity reversal: support that breaks does not stay neutral, it becomes resistance.
The six weeks since the April low have done nothing but rally back into it. Now the chart is here.
Above $47, the next test is the falling trendline that has defined this entire decline. Draw it from the June 2025 high above $82, across the January 2026 lower high near $63, and the line sits around $54 today, sliding lower roughly a dollar a week. That is the line that says the multi-month downtrend is still in force. As long as price stays underneath it, every rally is a counter-trend move inside a larger pattern of lower highs. A confirmed daily close above $47 puts that $54 line in play for NVO. A confirmed daily close above $54 is what ends the downtrend.
The aggressive long is the break of $47 on a daily close, sized for a stop back below $45, which is the last clean swing high underneath. The conservative version waits for the close above $47 and a back-test that holds the level from above, which would put the entry closer to $46 with a tighter stop. Both setups carry the same upside reference: $54 first, the descending trendline next.
The thesis fails on a daily close back below $43. That bar takes price out of the breakout zone, voids the test of resistance, and puts $40 and then the $35.10 low back on the chart. As long as $43 holds, the working bias is the breakout retest. Below it, the recovery is just another lower high inside the larger downtrend.
A 33% move off the low in six weeks gets a stock to the level that decides whether the recovery has staying power. NVO is at that level now. The chart at $47, the line $7 above it, and the close is what tells the story.
Author

Benjamin Pool
Verified Investing
A seasoned financial expert with a passion for empowering individuals to mastering smart money management.


