|

Newmont Mining (NEM) starts a new bullish cycle

Newmont Mining (ticker: NEM) is the world’s largest gold mining company, based in Greenwood Village, Colorado, United States. The stock may have formed a significant low at 37.57 on November 2022 and started a new bullish cycle. This article looks at the Elliott Wave Outlook for the stock.

Newmont monthly Elliott Wave chart

Chart

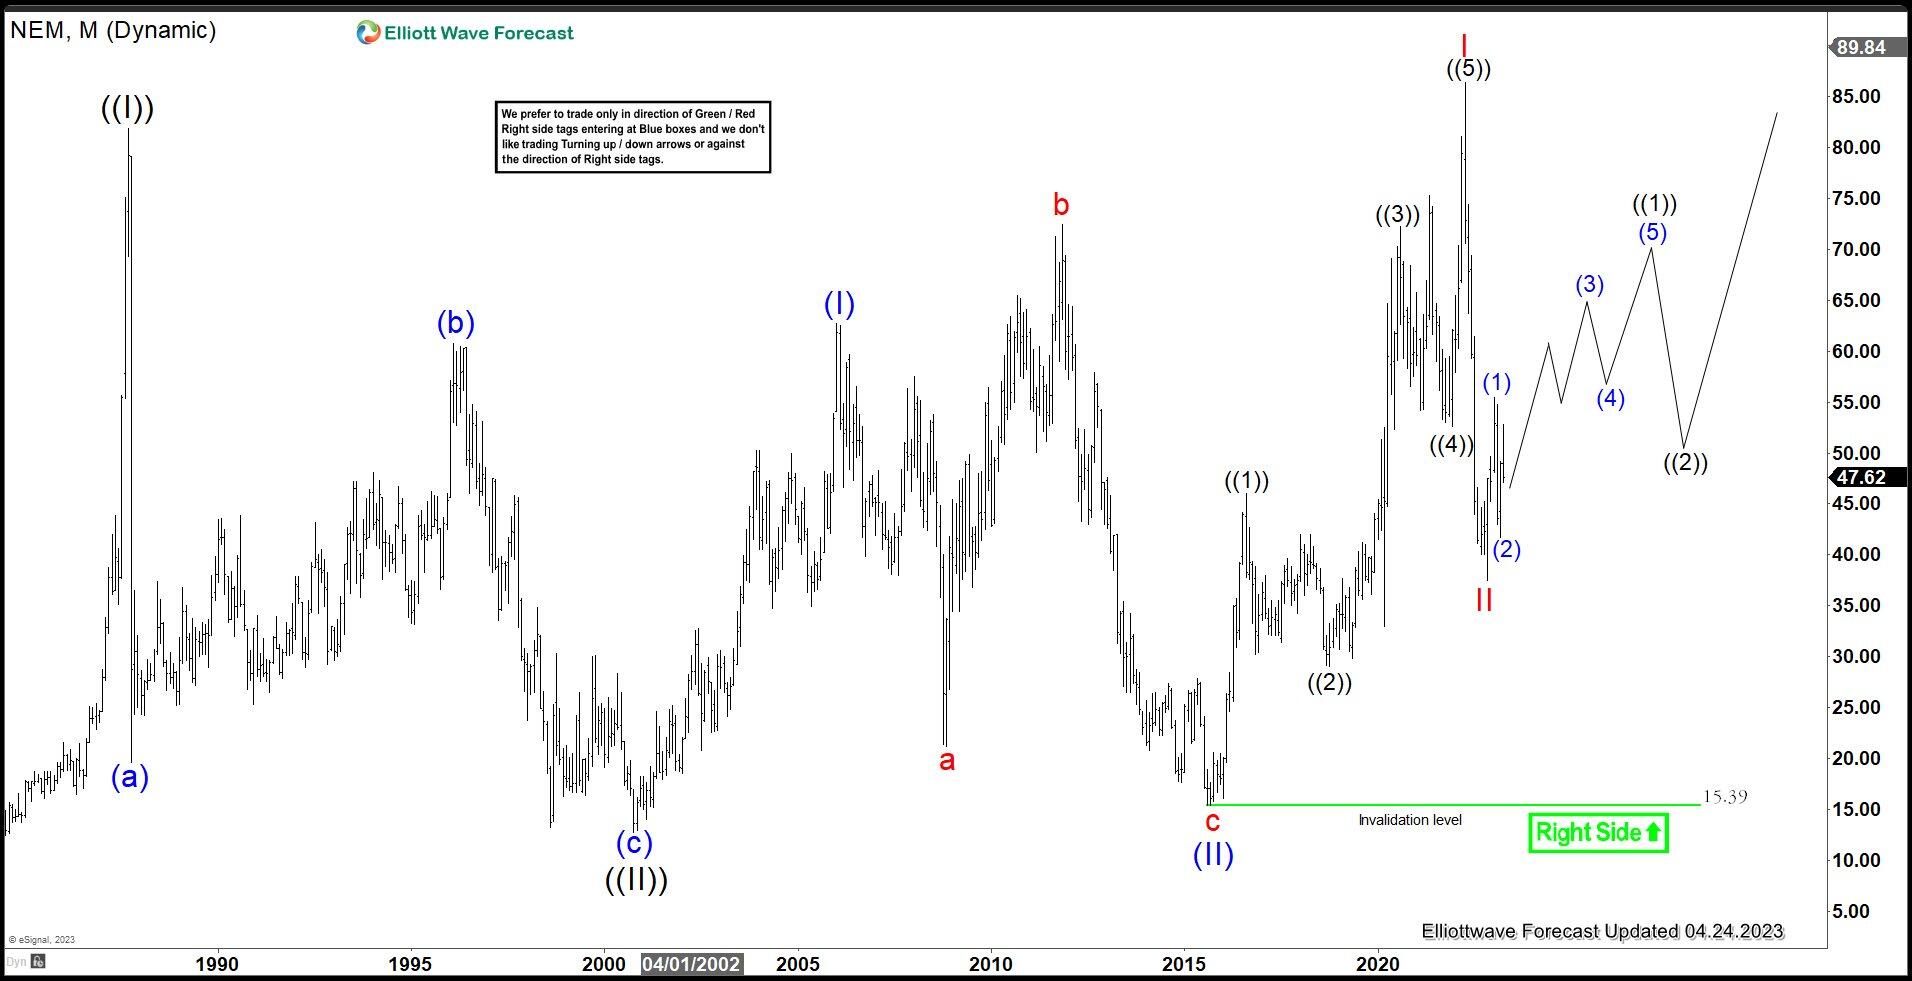
Monthly Elliott Wave Chart in Newmont Mining (NEM) above shows a bullish sequence as it broke above the previous peak wave ((I)) on September 1987 at 81.92. Wave ((II)) pullback has ended in 3 swing at 12.75 and stock resumes higher in a new impulsive structure within wave ((III)). Up from wave ((II)), wave (I) ended at 62.72 and pullback in wave (II) ended at 15.39. Then stock rallied higher in wave I of (III) at 86.37 and wave II of (III) ended at 37.45. Expect the stock to extend higher while pivot at 15.39 low remains intact.

Newmont daily Elliott Wave chart

Chart

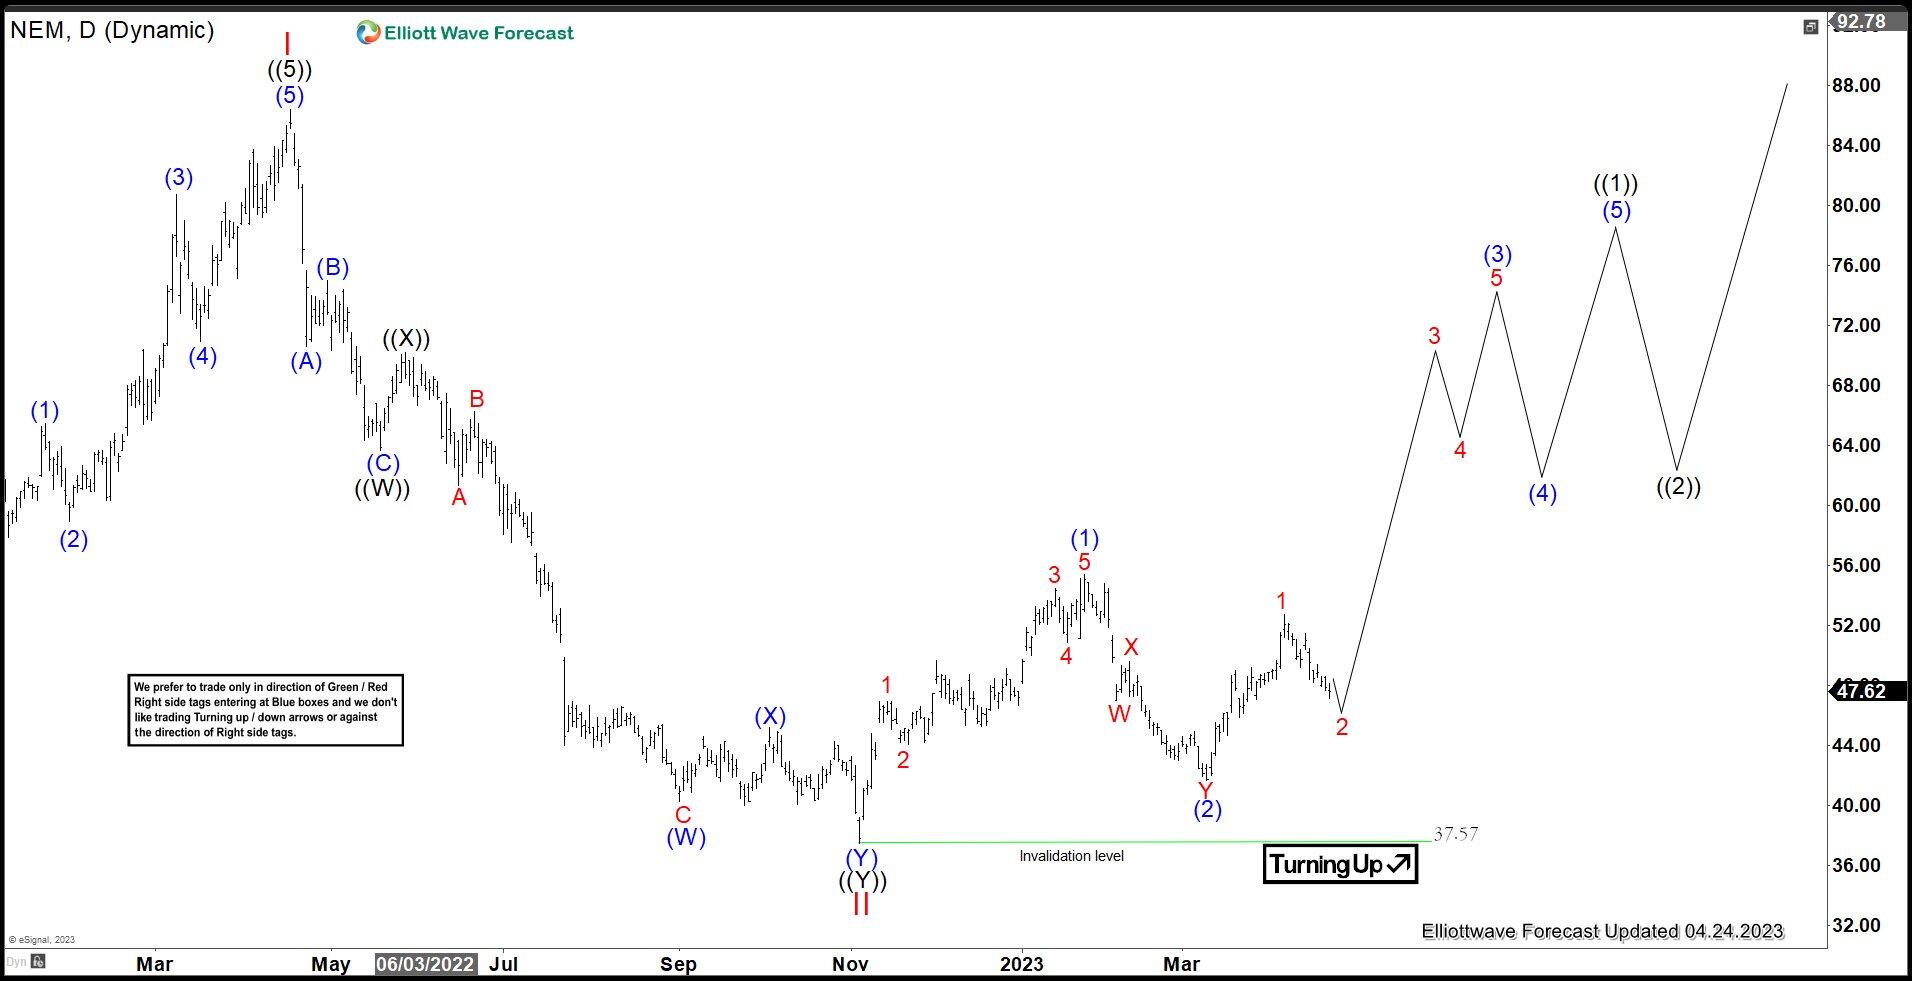
Daily Elliott Wave for Newmont Mining (NEM) above shows that the stock ended wave II pullback at 37.57. It has turned higher in wave III. Up from wave II, wave (1) ended at 55.41 and dips in wave (2) ended at 41.68. As far as pivot at 37.57 low stays intact, expect the stock to extend higher.

Author

Elliott Wave Forecast Team

Elliott Wave Forecast Team

ElliottWave-Forecast.com

More from Elliott Wave Forecast Team
Share:

Markets move fast. We move first.

Orange Juice Newsletter brings you expert driven insights - not headlines. Every day on your inbox.

By subscribing you agree to our Terms and conditions.

Editor's Picks

EUR/USD: Bulls pray for a dovish Fed

EUR/USD has finally taken a breather after a pretty energetic climb. The pair broke above 1.1680 in the second half of the week, reaching its highest levels in around two months before running into some selling pressure. Even so, it has gained almost two cents from the late-November dip just below 1.1500 the figure.

GBP/USD trims gains, recedes toward 1.3320

GBP/USD is struggling to keep its daily advance, coming under fresh pressure and retreating to the 1.3320 zone following a mild bullish attempt in the Greenback. Even though US consumer sentiment surprised to the upside, the US Dollar isn’t getting much love, as traders are far more interested in what the Fed will say next week.

Gold: Bullish momentum fades despite broad USD weakness

After rising more than 3.5% in the previous week, Gold has entered a consolidation phase and fluctuated at around $4,200. The Federal Reserve’s interest rate decision and revised Summary of Economic Projections, also known as the dot plot, could trigger the next directional move in XAU/USD. 

Week ahead: Rate cut or market shock? The Fed decides

Fed rate cut widely expected; dot plot and overall meeting rhetoric also matter. Risk appetite is supported by Fed rate cut expectations; cryptos show signs of life. RBA, BoC and SNB also meet; chances of surprises are relatively low. Dollar weakness could linger; both the aussie and the yen best positioned to gain further. Gold and oil eye Ukraine-Russia developments; a peace deal remains elusive.

Week ahead – Rate cut or market shock? The Fed decides

Fed rate cut widely expected; dot plot and overall meeting rhetoric also matter. Risk appetite is supported by Fed rate cut expectations; cryptos show signs of life. RBA, BoC and SNB also meet; chances of surprises are relatively low.

Ripple faces persistent bear risks, shrugging off ETF inflows

Ripple is extending its decline for the second consecutive day, trading at $2.06 at the time of writing on Friday. Sentiment surrounding the cross-border remittance token continues to lag despite steady inflows into XRP spot ETFs.