EUR/GBP Price Forecast: Cross remains capped near bottom of bullish channel
- EUR/GBP bounces up from 0.8540 lows but remains capped below 0.8570 so far.
- Final Manufacturing PMI data from Europe and the UK have been revised down on Monday.
- The pair is still showing a bullish structure but is struggling to return to the ascending channel.
The Euro (EUR) ticks higher against the British Pound (GBP) on Monday but remains capped below the bottom of an ascending channel at the 0.8575 area following Thursday and Friday's declines.
July’s Manufacturing Purchasing Managers Index (PMI) figures have been revised lower in the UK and the Eurozone, although the latter shows an improvement from June, while in the UK the sector’s activity slowed down compared to the previous month.
Beyond that, the uncertainty about the BoE’s monetary policy remains a significant hurdle for GBP recovery. Analysts at TD Securities observe that last week’s decision suggests that the majority of the committee “is still very comfortable keeping rates on hold, given the lack of clear second-round effects observed in inflation data.” In this context, “we think the knee-jerk GBP rally should be faded vs the EUR and USD. Further paring back of September BoE rate hike pricing could weigh on GBP,” say the analysts.
Technical analysis: Bulls are attempting to break the reverse trendline
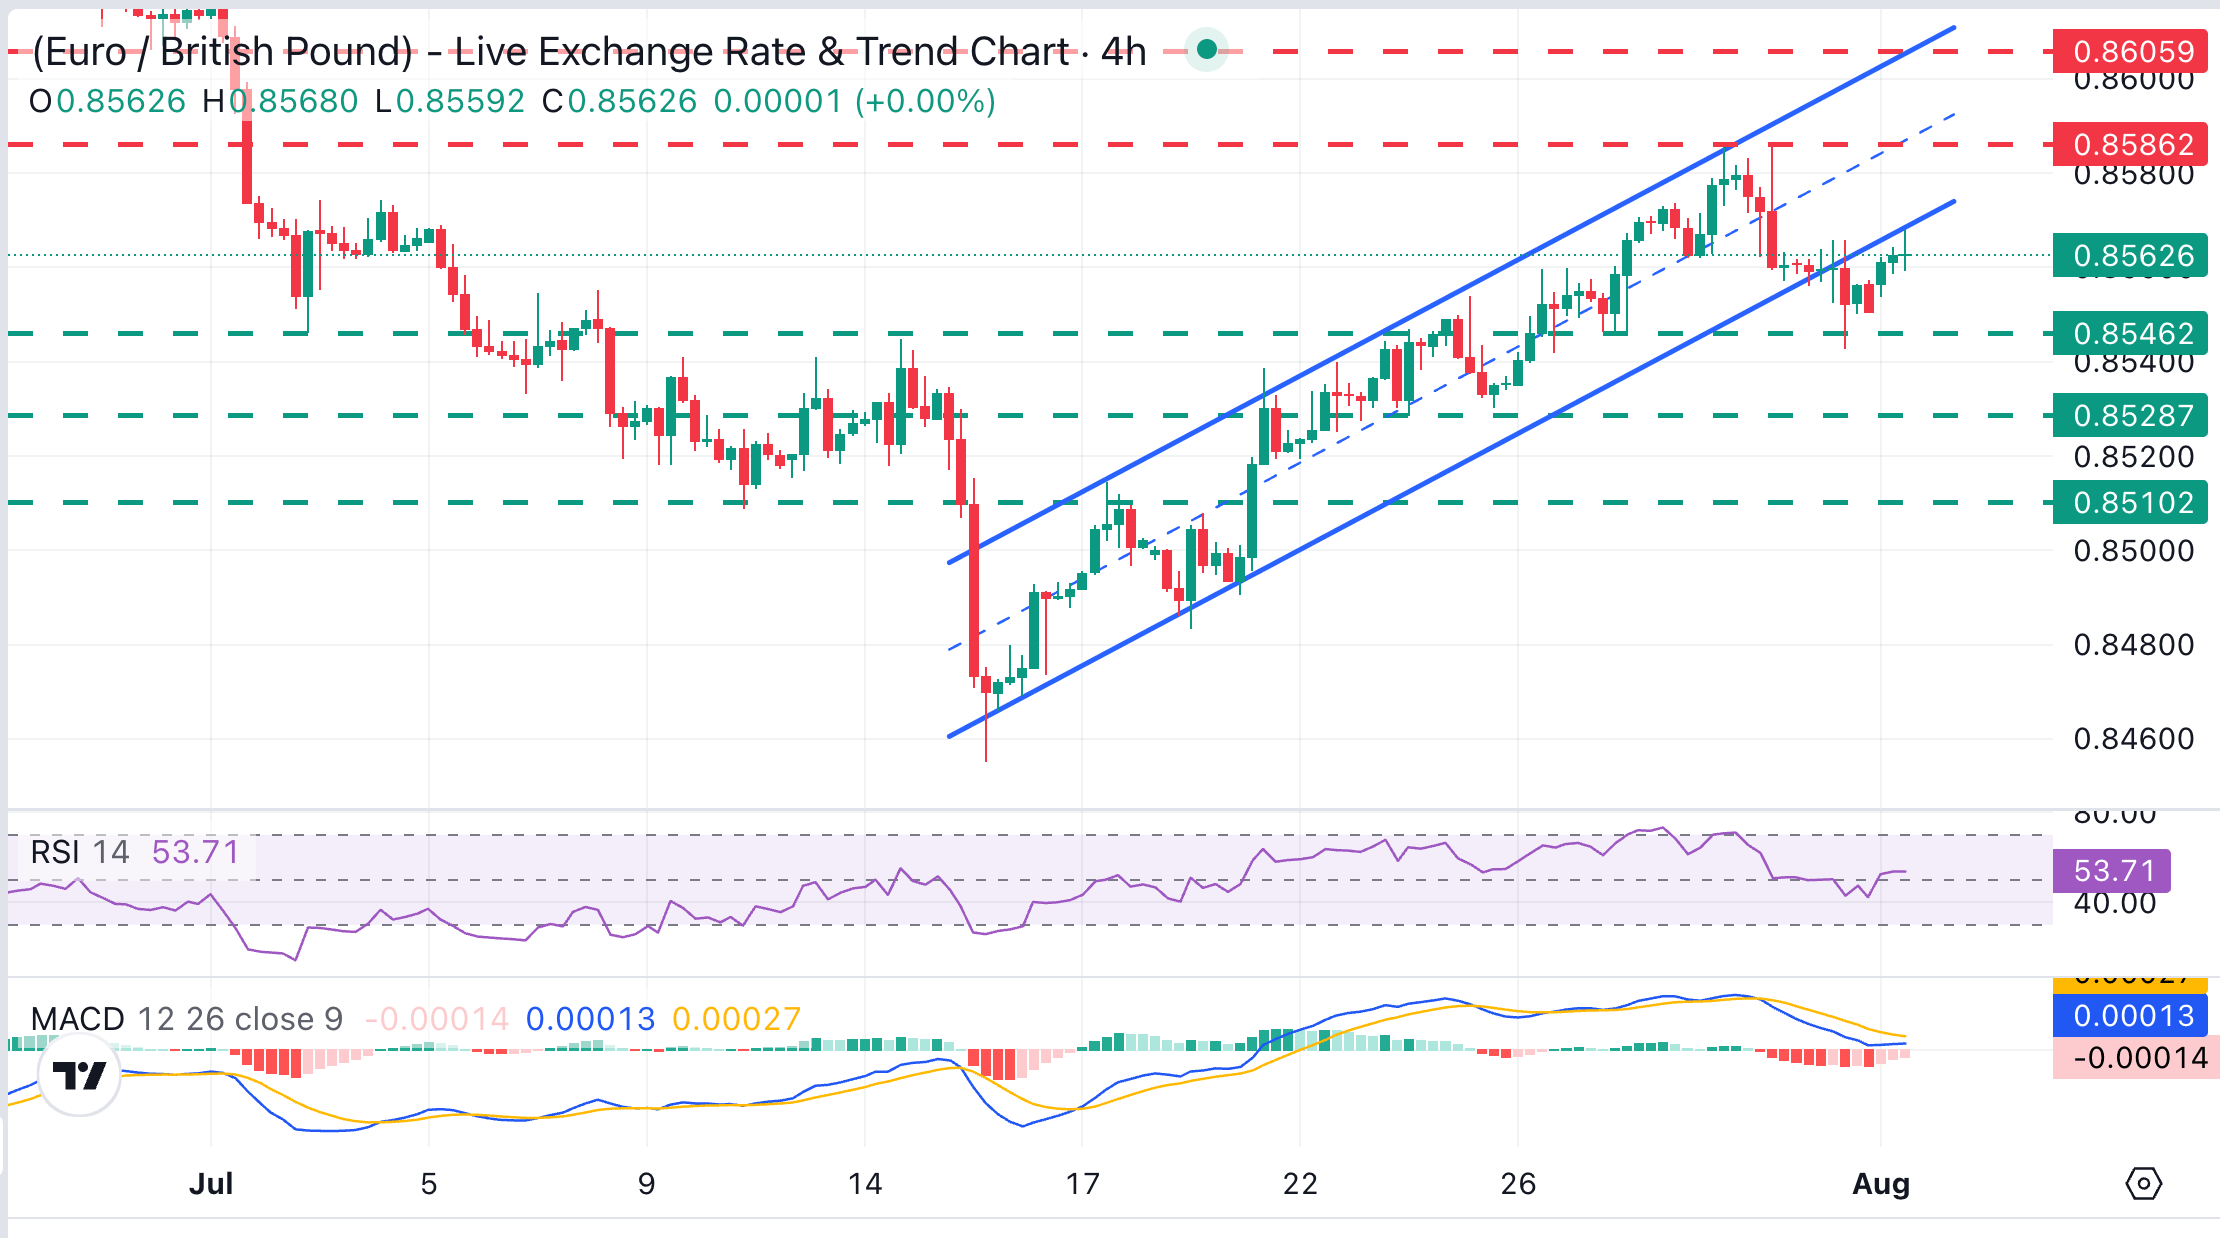
EUR/GBP trades at 0.8562, slipping just under the rising channel floor around 0.8570, which keeps the cross capped in the near term. Momentum indicators are mixed, with the 4-hour Relative Strength Index (RSI 14) around 53 and the Moving Average Convergence Divergence (MACD) fractionally negative, hinting at fading upside traction.
Failure to return above 0.8570 might encourage bears to retest the 0.8545 area, which capped bears on Friday and on July 28, as well as the July 23 low at 0.8530. On the topside, a confirmation above 0.8570 would expose the July 30 high at 0.8585. Further up, the late June lows just above 0.8600 emerge as the next resistance area.
(The technical analysis of this story was written with the help of an AI tool. Know more.)
Euro Price Today
The table below shows the percentage change of Euro (EUR) against listed major currencies today. Euro was the strongest against the Australian Dollar.
| USD | EUR | GBP | JPY | CAD | AUD | NZD | CHF | |
|---|---|---|---|---|---|---|---|---|
| USD | -0.08% | 0.07% | -0.50% | 0.05% | 0.20% | -0.00% | 0.05% | |
| EUR | 0.08% | 0.14% | -0.45% | 0.12% | 0.26% | 0.11% | 0.09% | |
| GBP | -0.07% | -0.14% | -0.57% | -0.05% | 0.12% | -0.02% | -0.03% | |
| JPY | 0.50% | 0.45% | 0.57% | 0.49% | 0.63% | 0.50% | 0.45% | |
| CAD | -0.05% | -0.12% | 0.05% | -0.49% | 0.14% | 0.01% | -0.04% | |
| AUD | -0.20% | -0.26% | -0.12% | -0.63% | -0.14% | -0.16% | -0.14% | |
| NZD | 0.00% | -0.11% | 0.02% | -0.50% | -0.01% | 0.16% | 0.00% | |
| CHF | -0.05% | -0.09% | 0.03% | -0.45% | 0.04% | 0.14% | -0.01% |
The heat map shows percentage changes of major currencies against each other. The base currency is picked from the left column, while the quote currency is picked from the top row. For example, if you pick the Euro from the left column and move along the horizontal line to the US Dollar, the percentage change displayed in the box will represent EUR (base)/USD (quote).
Author

Guillermo Alcala
FXStreet
Graduated in Communication Sciences at the Universidad del Pais Vasco and Universiteit van Amsterdam, Guillermo has been working as financial news editor and copywriter in diverse Forex-related firms, like FXStreet and Kantox.