|

Netflix Inc. $NFLX blue box area offers a buying opportunity

In today’s article, we’ll examine the recent performance of Netflix Inc. ($NFLX) through the lens of Elliott Wave Theory. We’ll review how the decline from the June 30, 2025, high unfolded as a 7-swing correction (WXY) and discuss our forecast for the next move. Let’s dive into the structure and expectations for this stock.

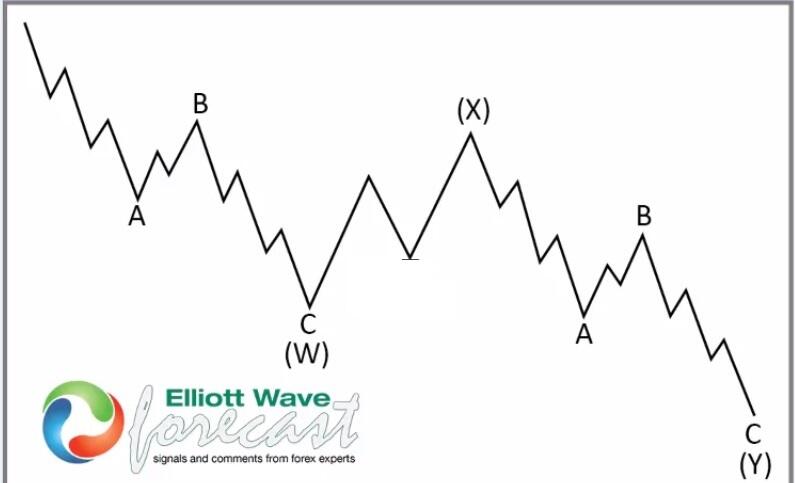
7-swing WXY correction

$NFLX four-hour Elliott Wave chart 7.20.2025

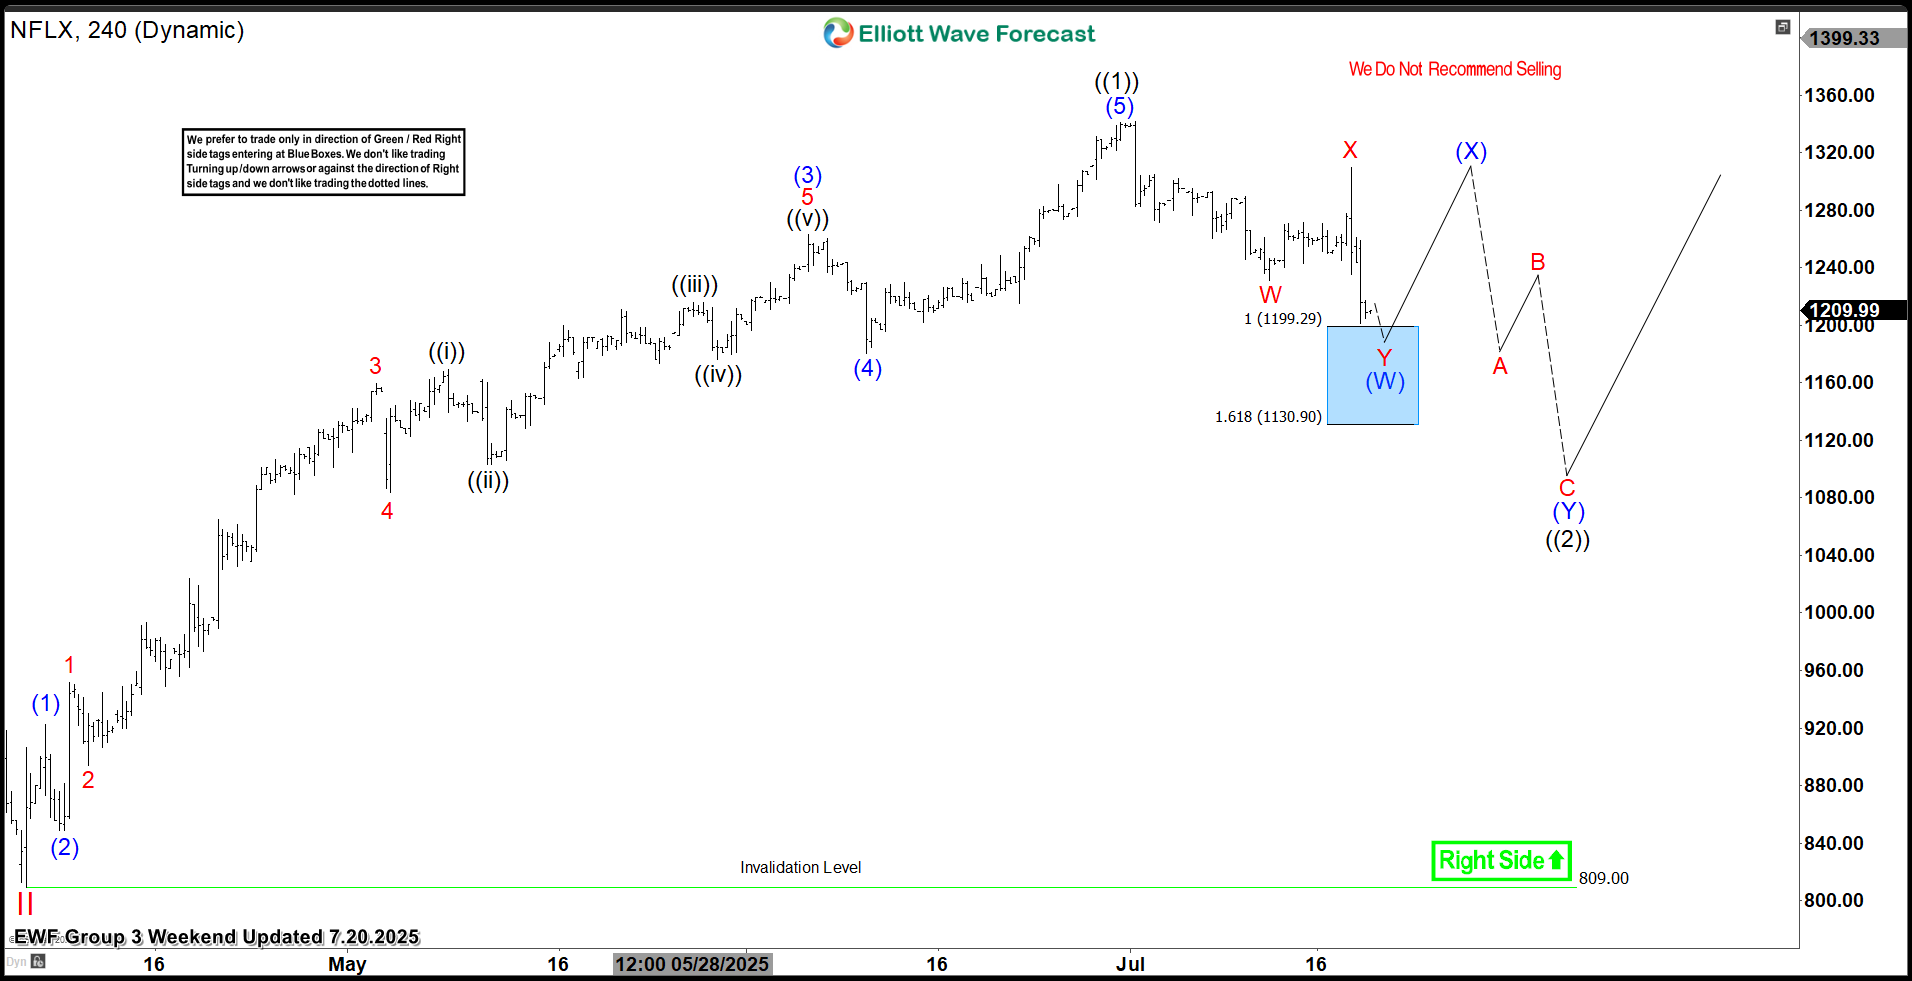
In the 4H Elliott Wave count from July 20, 2025, we saw that $NFLX completed a 5-wave impulsive cycle at black ((1)). As expected, this initial wave prompted a pullback. We anticipated this pullback to unfold in 7 swings, likely finding buyers in the equal legs area between $1199.29 and $1130.90.

This setup aligns with a typical Elliott Wave correction pattern (WXY), in which the market pauses briefly before resuming its primary trend.

$NFLX four-hour Elliott Wave chart 7.27.2025

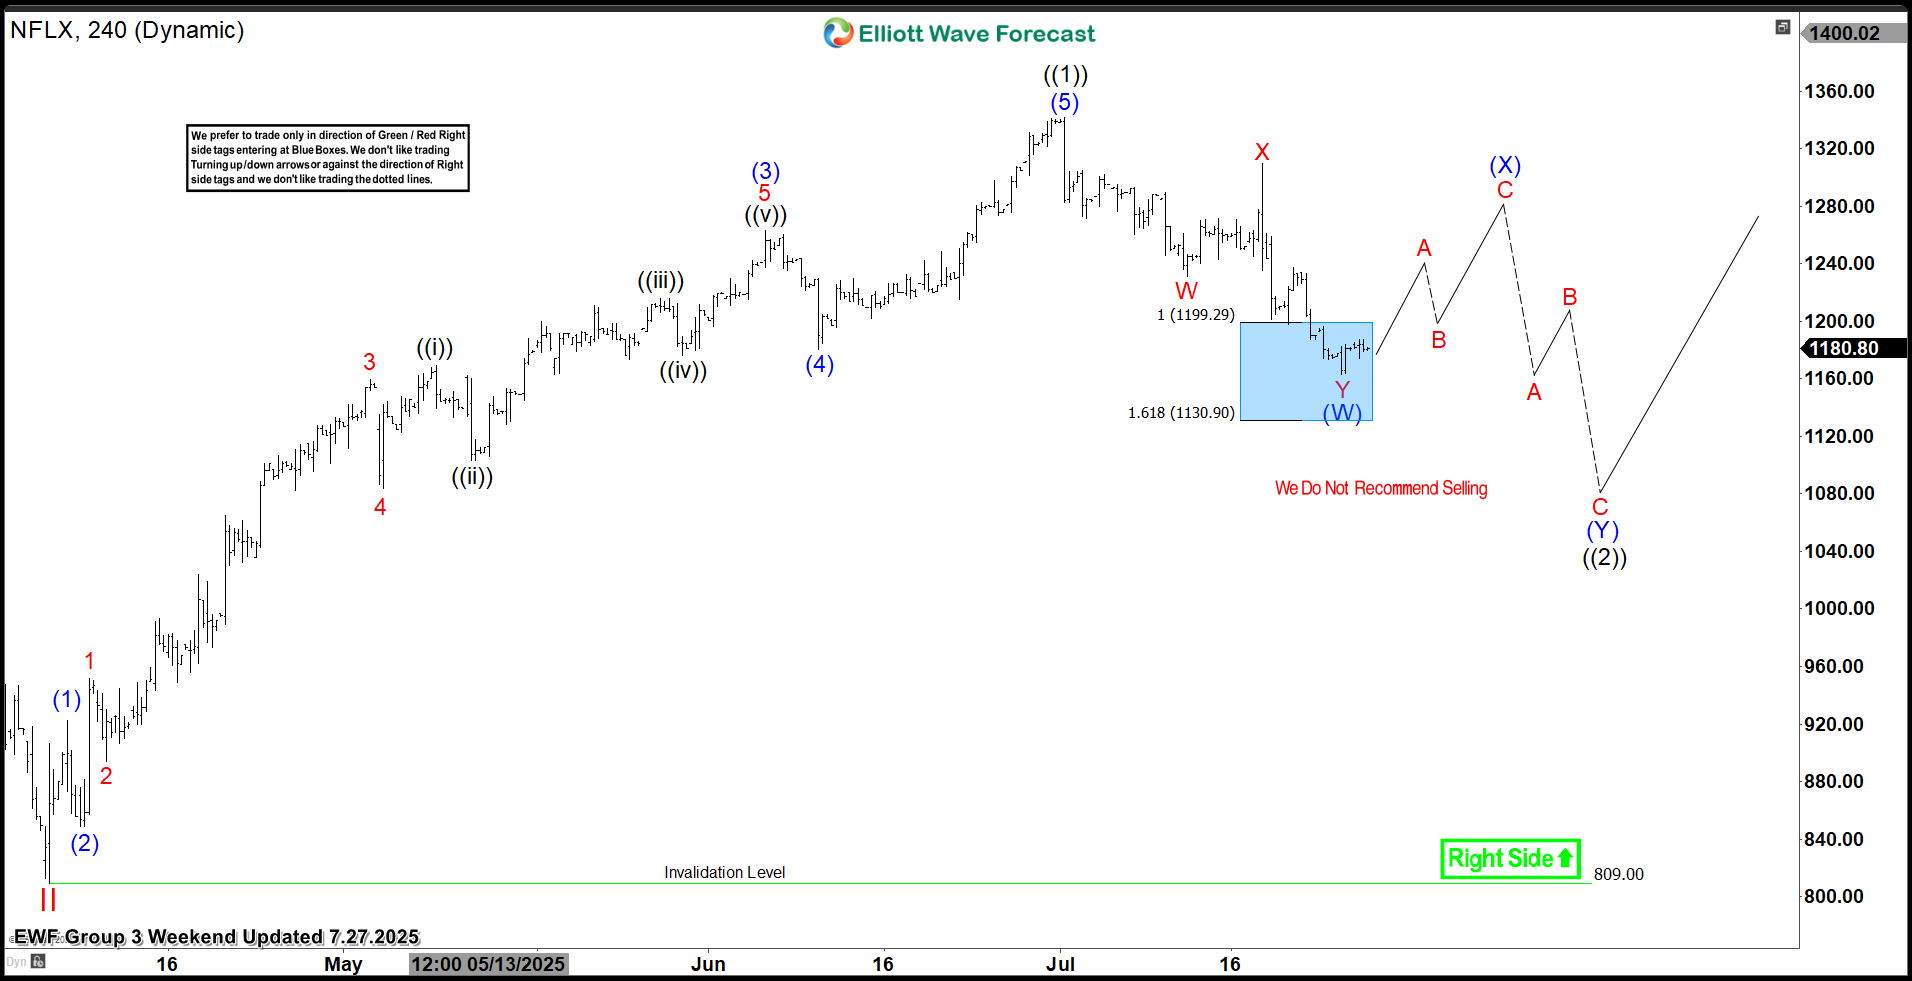
The most recent update, from July 27, 2025, shows that the stock has found a low as predicted. After the decline from the June peak, the stock is now finding support from the equal legs area. Currently, it is looking for a corrective bounce towards 1240 – 1280. After that, the stock is expected to continue lower in wave ((2)) before a renewed bullish cycle takes place.

Conclusion

In conclusion, our Elliott Wave analysis of Netflix Inc. ($NFLX) suggests that it remains supported against April 2025 lows. As a result, traders should buy the dips and monitor the $1240–$1280 zone as the next potential target. In the meantime, keep an eye out for any corrective pullbacks that may offer entry opportunities. By applying Elliott Wave Theory, traders can better anticipate the structure of upcoming moves and enhance risk management in volatile markets.

Author

Elliott Wave Forecast Team

Elliott Wave Forecast Team

ElliottWave-Forecast.com

More from Elliott Wave Forecast Team
Share:

Editor's Picks

GBP/USD clings to daily gains near 1.3350

GBP/USD holds just in positive territory around 1.3350 on Friday as the Greenback keeps a vacillating price action. With Fed rate hike expectations easing and US markets closed for the Independence Day holiday, Cable remains on track to post solid weekly gains.

EUR/USD remains sidelined around 1.1440

EUR/USD holds on to its recent gains and consolidates around 1.1440 at the end of the week as the US Dollar lacks clear direction. In the meantime, trading conditions remain subdued, with volatility constrained by the closure of US markets for the Independence Day holiday.

Gold flirts with two-week highs, targets $4,200

Gold extends its recovery for a third straight day, advancing toward the $4,200 mark per troy ounce on Friday. The precious metal looks set to snap a four-week losing streak as softer-than-expected June US NFP data prompt investors to scale back expectations of further Fed tightening.

Crypto Today: Bitcoin, Ethereum, XRP advance amid renewed capital inflows

Bitcoin maintains its upward momentum, holding above the $61,000 mark at the time of writing on Friday. Major altcoins such as Ethereum and Ripple are also posting gains, signaling a modest uptick in market sentiment and renewed risk appetite among investors.

The Iran war failed to trigger a recession. Can the US economy keep defying expectations?

Nearly four months after the start of the Iran war, the US economy remains remarkably resilient. While the conflict initially triggered a severe disruption to global energy markets and a sharp rise in Oil prices, recent diplomatic progress between Washington and Tehran has eased concerns about a prolonged supply shock.

Kevin Warsh offers no policy clues: Why markets still got their answer

Financial markets came to Sintra looking for clues about the Federal Reserve's (Fed) next move. They largely left with confirmation that Fed Chair Kevin Warsh intends to make those clues much harder to find.