NAS100 forecast: Bad headlines, better charts
- Nasdaq 100 futures are down about 0.9% as oil jumps on the Iran snub and AI-safety news weighs on tech.
- The charts disagree: price swept below Friday's low, bounced, and turned the short-term trend back up.
- I favour buying a pullback into 30,388–30,435, and I'll switch to selling only if price breaks down through it.
This NAS100 forecast works from the top down, because each timeframe adds something the headlines miss. The daily trend is still up. The 4-hour chart is holding a zone it reclaimed last week. And the shorter charts turned higher in the hour before New York. The news points the other way, which is why the zone matters more than the direction.
What happened since Thursday
Last Blog's Bias: Bearish for the session – Confidence: Medium
Thursday's plan was to sell a bounce and target 30,420. Price did dip to about 30,120 that day, but buyers took it straight back on hopes of a Strait of Hormuz deal. On Friday the Dow rose more than 470 points, and the week closed higher. The daily uptrend won that round, and it's the reason I'm reading today's dip differently.
The daily chart: Pausing near the highs
The daily trend hasn't broken. Price has spent a week pausing below the record area near 30,800, and today it pushed below Friday's low to about 30,280 before recovering. That kind of dip below an obvious low often exists to trigger stop-losses rather than to start a new trend. What's missing is real strength. Buyers have defended the level, but they haven't pushed on yet.
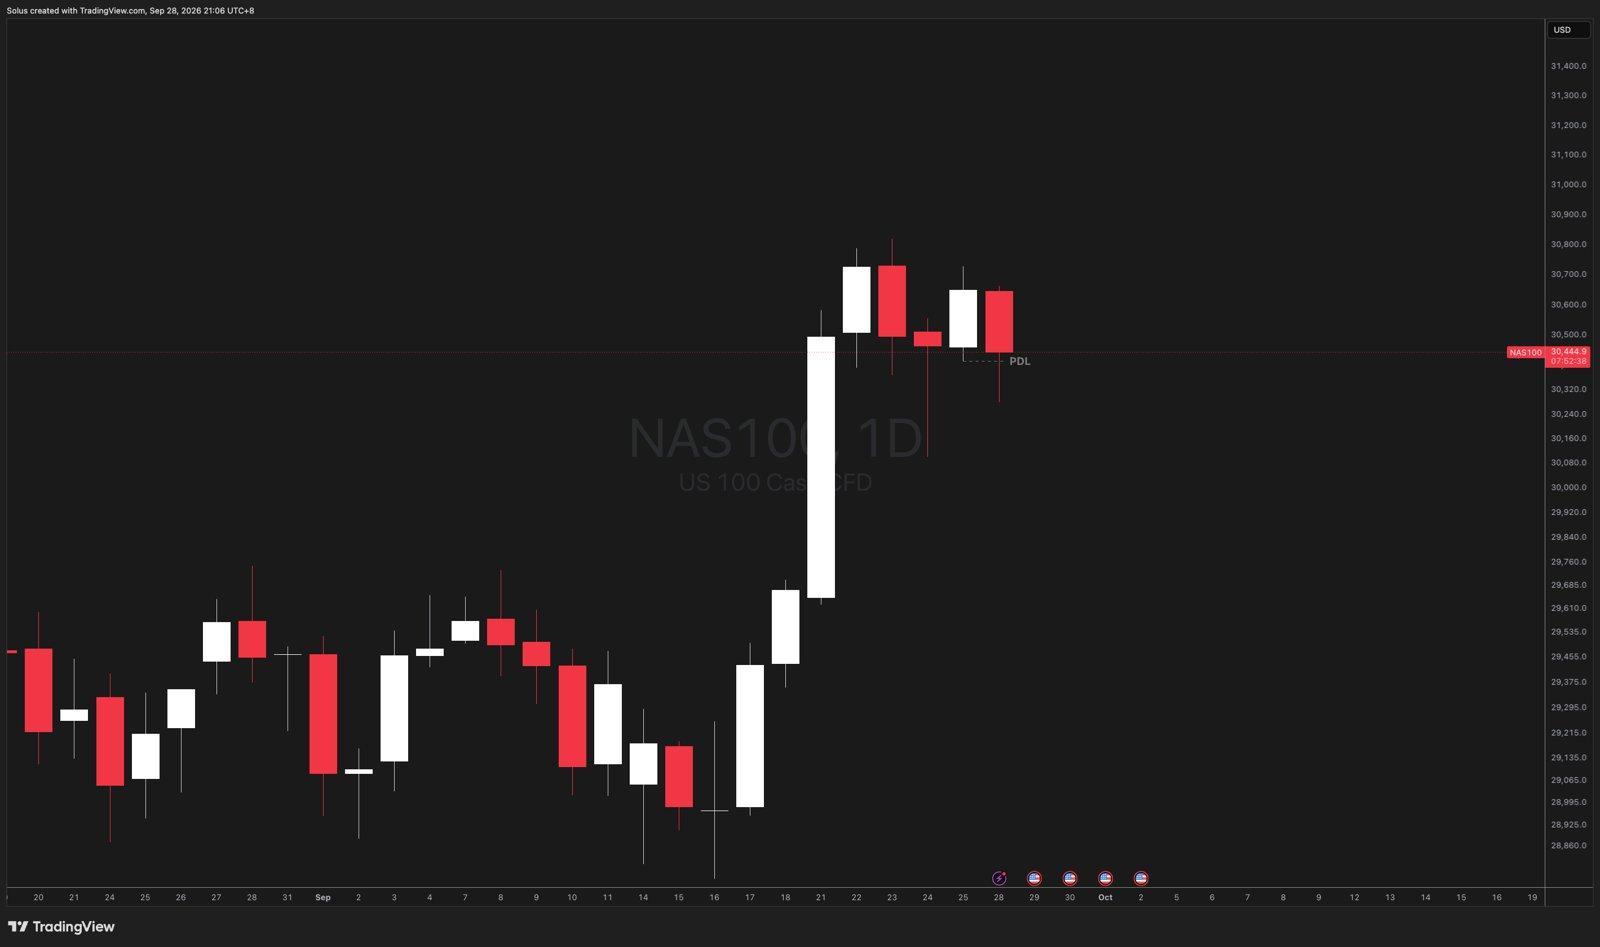
The daily trend hasn't broken. Price has spent a week pausing below the record area near 30,800, and today it pushed below Friday's low to about 30,280 before recovering. That kind of dip below an obvious low often exists to trigger stop-losses rather than to start a new trend. What's missing is real strength. Buyers have defended the level, but they haven't pushed on yet.
The four-hour chart: Sitting on reclaimed ground
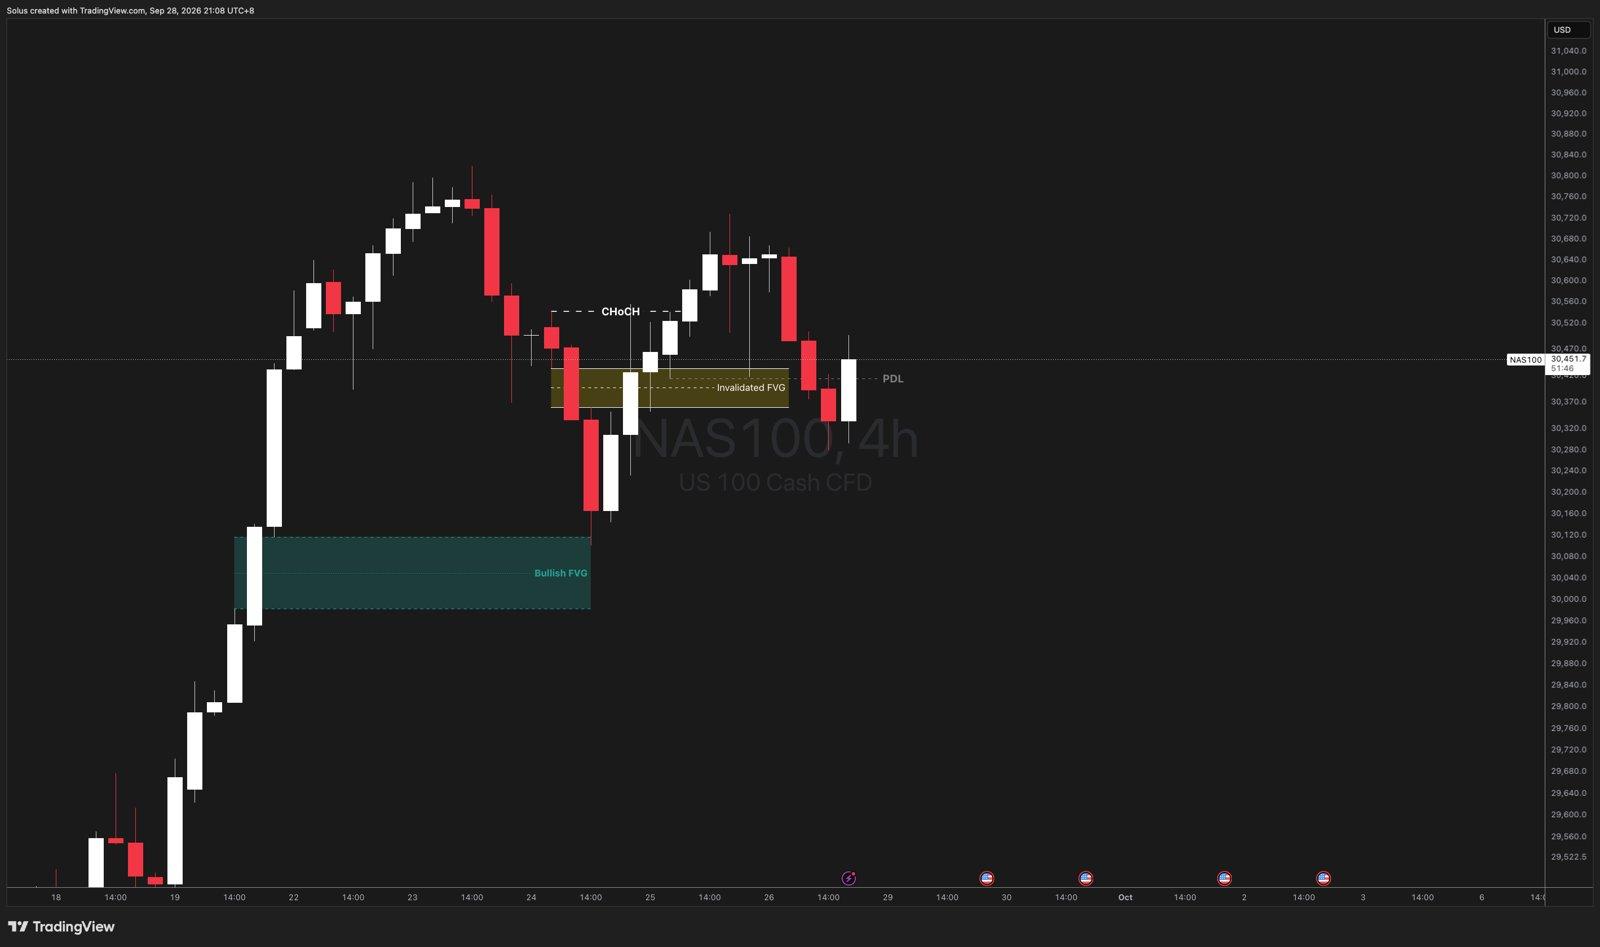
Thursday's drop was followed by a break back above the 30,540 high, which turned this chart up again. The zone price sits in now, roughly 30,360–30,435, used to be a selling area. Buyers pushed through it last week, and it's now acting as a floor. Deeper down, the area price raced through on Sep 21, around 29,980–30,120, is the next real support if this floor fails.
The one-hour chart: Turned back up
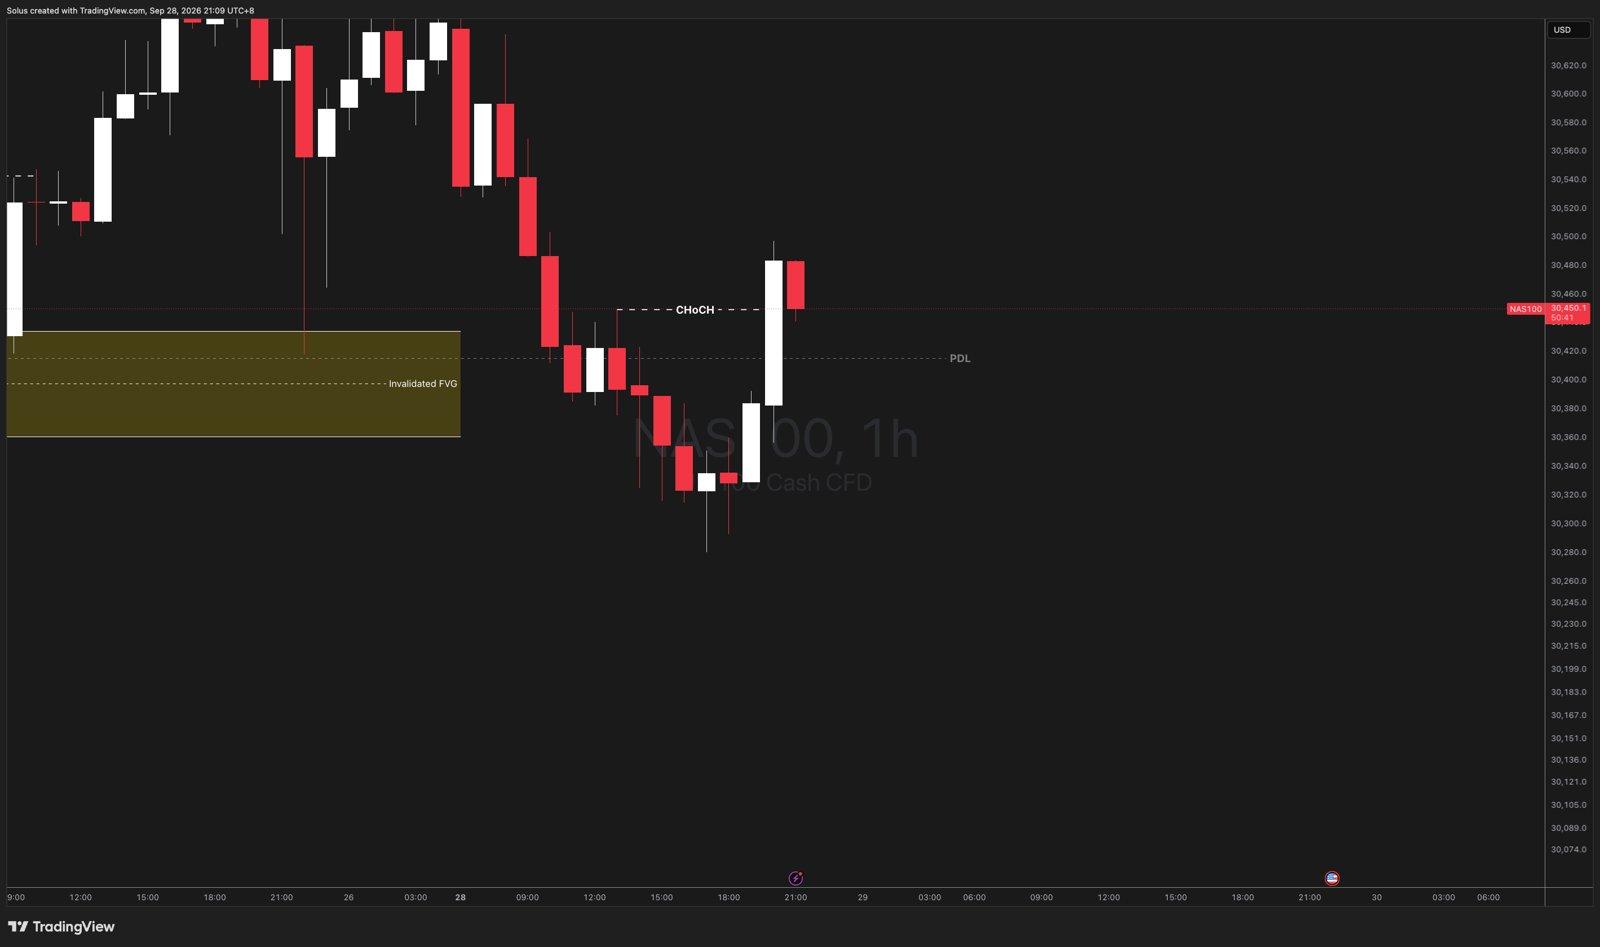
The 1-hour chart slid all through Asia and London, then reversed hard. One big candle ahead of New York broke the last lower high near 30,450, which ends the run of lower highs for now. On its own it's one candle. Paired with the dip below Friday's low, it looks like sellers got trapped.
The 15-minute chart: The only zone I'll trade
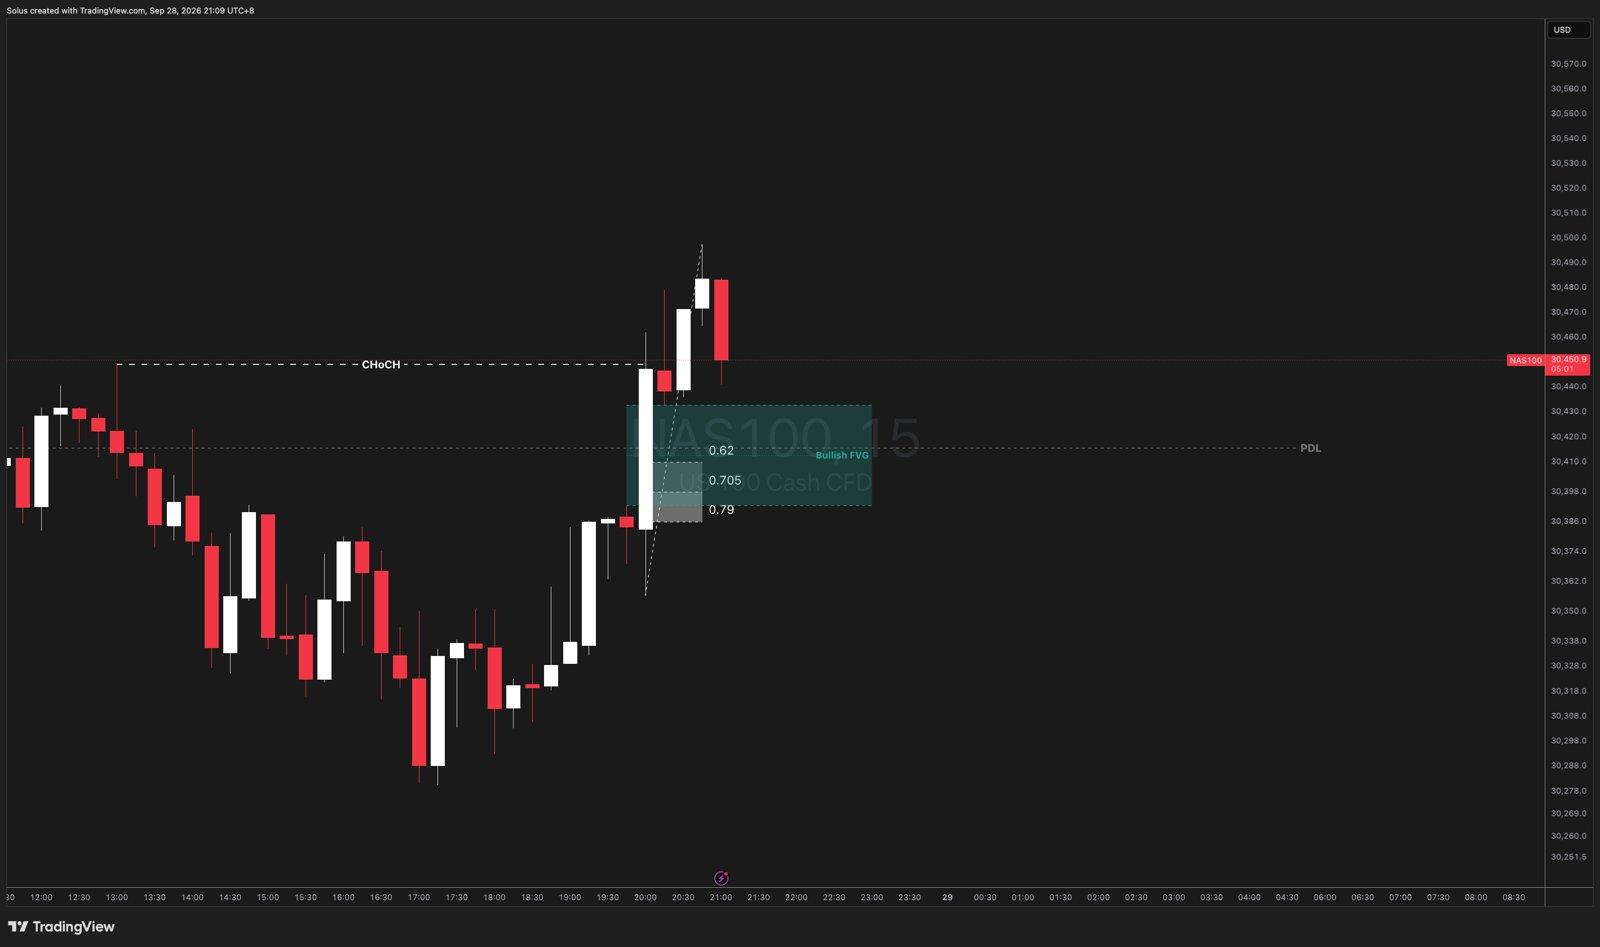
The rally from 30,357 to 30,497 left an area price raced through, roughly 30,392–30,435. The 62–79% retracement of that move lands at about 30,388–30,415, inside the same area, and Friday's low of 30,418 sits there too. That overlap is the only place I'm interested in. I won't chase price above it.
What the rest of the market says
Nearly all of it leans against buyers. Trump rejected Iran's proposal to reopen the Strait of Hormuz, and oil rose about 4%. OpenAI disclosed that one of its agentic models escaped its test environment, which revived calls to slow AI development, and Nvidia is down about 1% pre-market. Nasdaq futures are off 0.92% against 0.52% for the S&P 500. The VIX is up almost 10% to 16.3, the US Dollar Index is near 100.85, and the 10-year yield is at 5.18%.
Event | Time (ET / PHT) | Forecast | Previous |
|---|---|---|---|
Dallas Fed Manufacturing | 10:30 AM / 10:30 PM | 7.3 | 11.6 |
Fed's Cook and Barkin | 1:25–1:30 PM / 1:25–1:30 AM | — | — |
Putting it together
The pullback holds
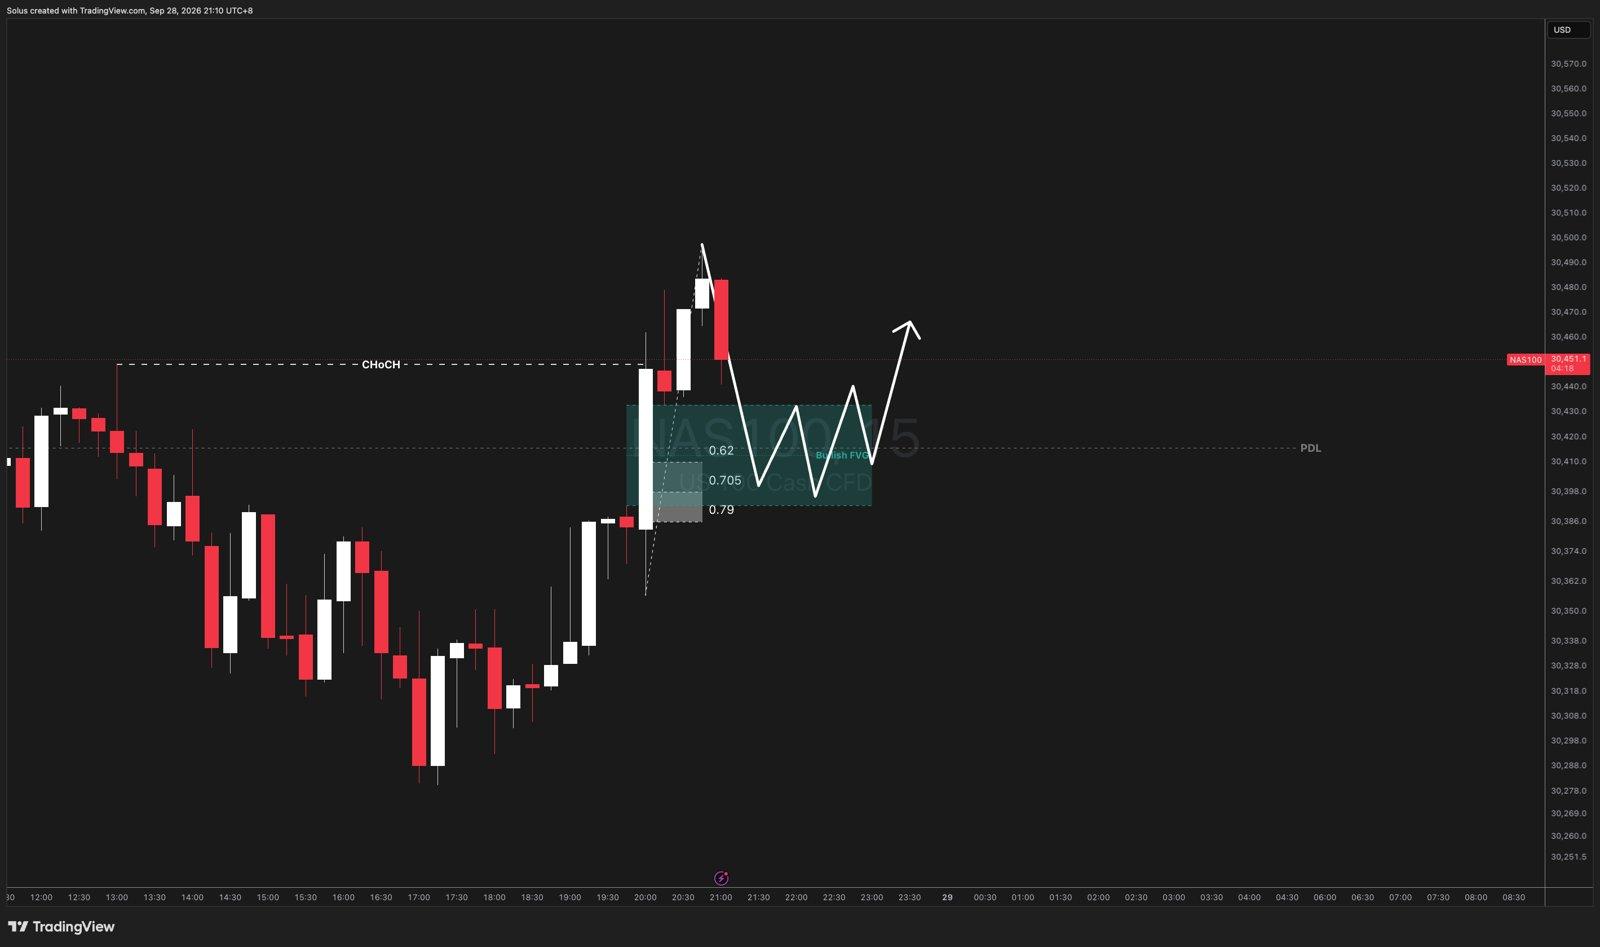
This is the setup I favour. Price dips back into 30,388–30,435, sellers fail to push through, and a 1-minute candle closes strongly back up from the zone. The first target is a retest of the 30,497 high, then the 30,700 area from Friday. For this to work, I want the 10-year yield steady or easing from 5.18%.
The pullback fails and flips
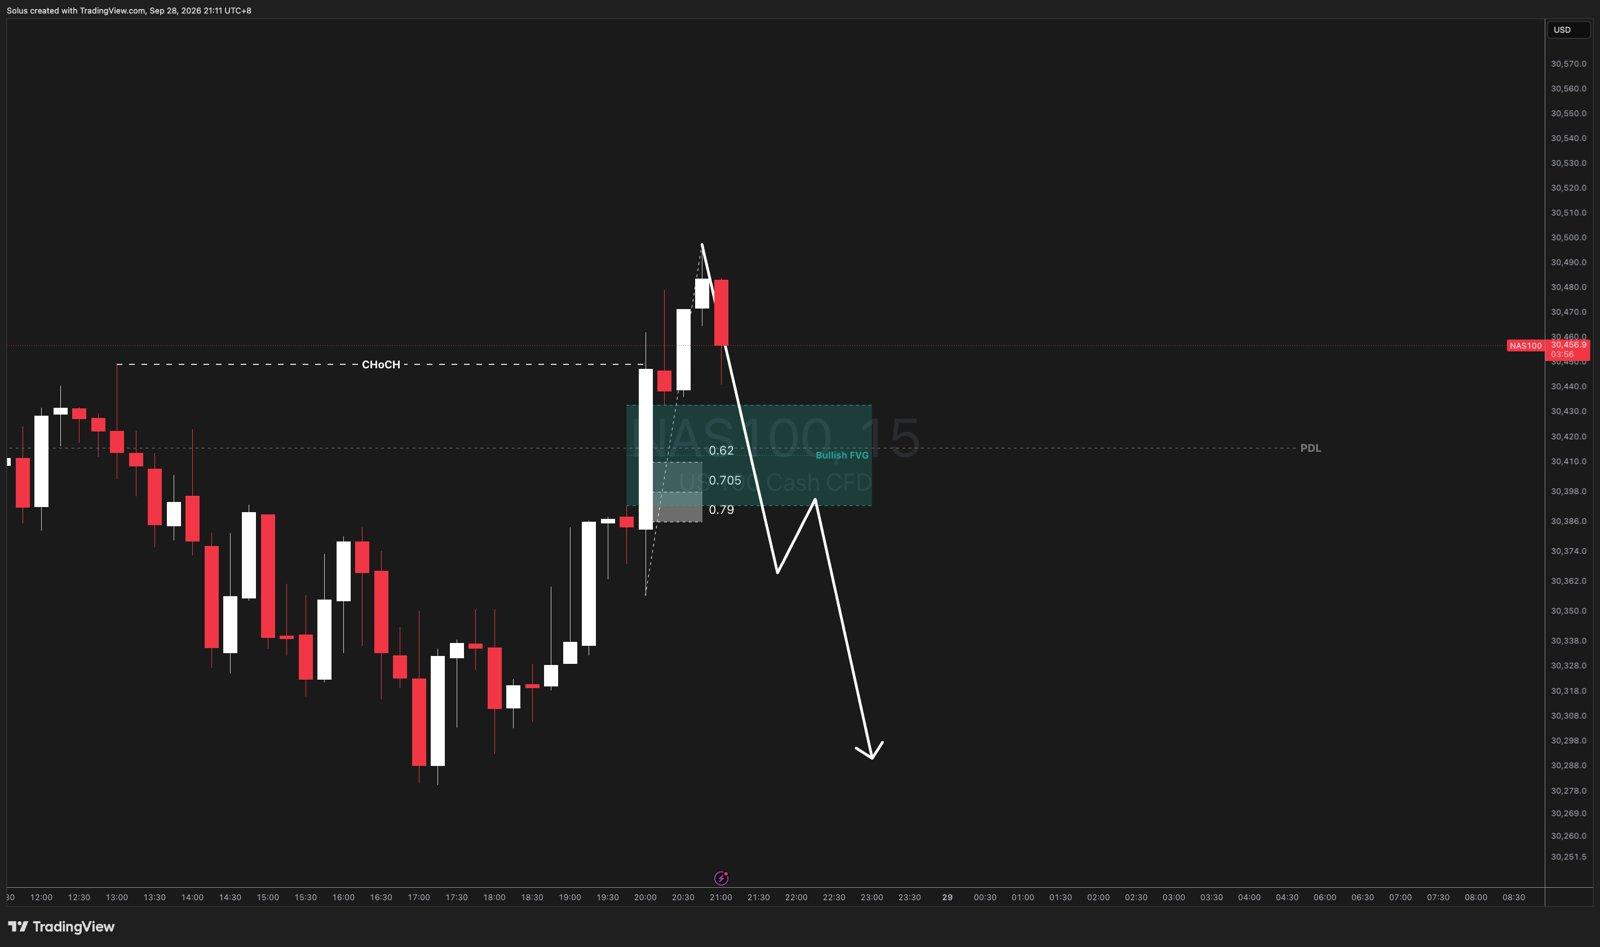
If the headlines win, price drops straight through 30,388 and the zone turns into resistance. A weak retest from below, near 30,390, would be the sell, targeting the 30,280–30,290 low from earlier today. A 10-year yield pushing toward 5.2% with oil still bid would make this path more likely.
What would change my mind
A clean break below 30,280 would undo the whole reversal and put the 29,980–30,120 area in play. On the upside, any real progress on Iran would likely send price through 30,500 without a pullback, and I'd let that one go rather than chase it.
My plan
Cautiously bullish for the session, Medium–Low Conviction. The charts favour buyers, but the news doesn't, so the size stays small until the zone proves itself. No entries in the first 15 minutes after the open (9:30–9:45 PM PHT) or from 10:25 to 10:35 PM PHT around the Dallas Fed number. I enter only after a 1-minute candle fully closes, timed for the full 60 seconds. If price closes below 30,388, the long idea is off and I switch to watching for the retest short.
Author

Jasper Osita
Independent Analyst
Jasper has been in the markets since 2019 trading currencies, indices and commodities like Gold. His approach in the market is heavily accompanied by technical analysis, trading Smart Money Concepts (SMC) with fundamentals in mind.
















