|

Microsoft Elliott Wave sequence favors extension lower

Microsoft Corporation is an American multinational technology corporation producing computer software, consumer electronics, personal computers, and related services headquartered at the Microsoft Redmond campus located in Redmond, Washington and listed on NASDAQ stock exchange with the ticker symbol (MSFT).

The series of rate hikes by the Fed has provided a challenge for the World Indices and individual stocks. Stock markets kept making a lower lows since they formed the peak in 2021. We saw a strong reaction higher after the low seen at the end of October or early November 2022 and many started to believe that correction is over and a new wave of bull market has started. However, in this blog, we will look at incomplete Elliott Wave Sequence in Microsoft which negates the view that correction is over at least in the tech stocks and related Indices / ETFs.

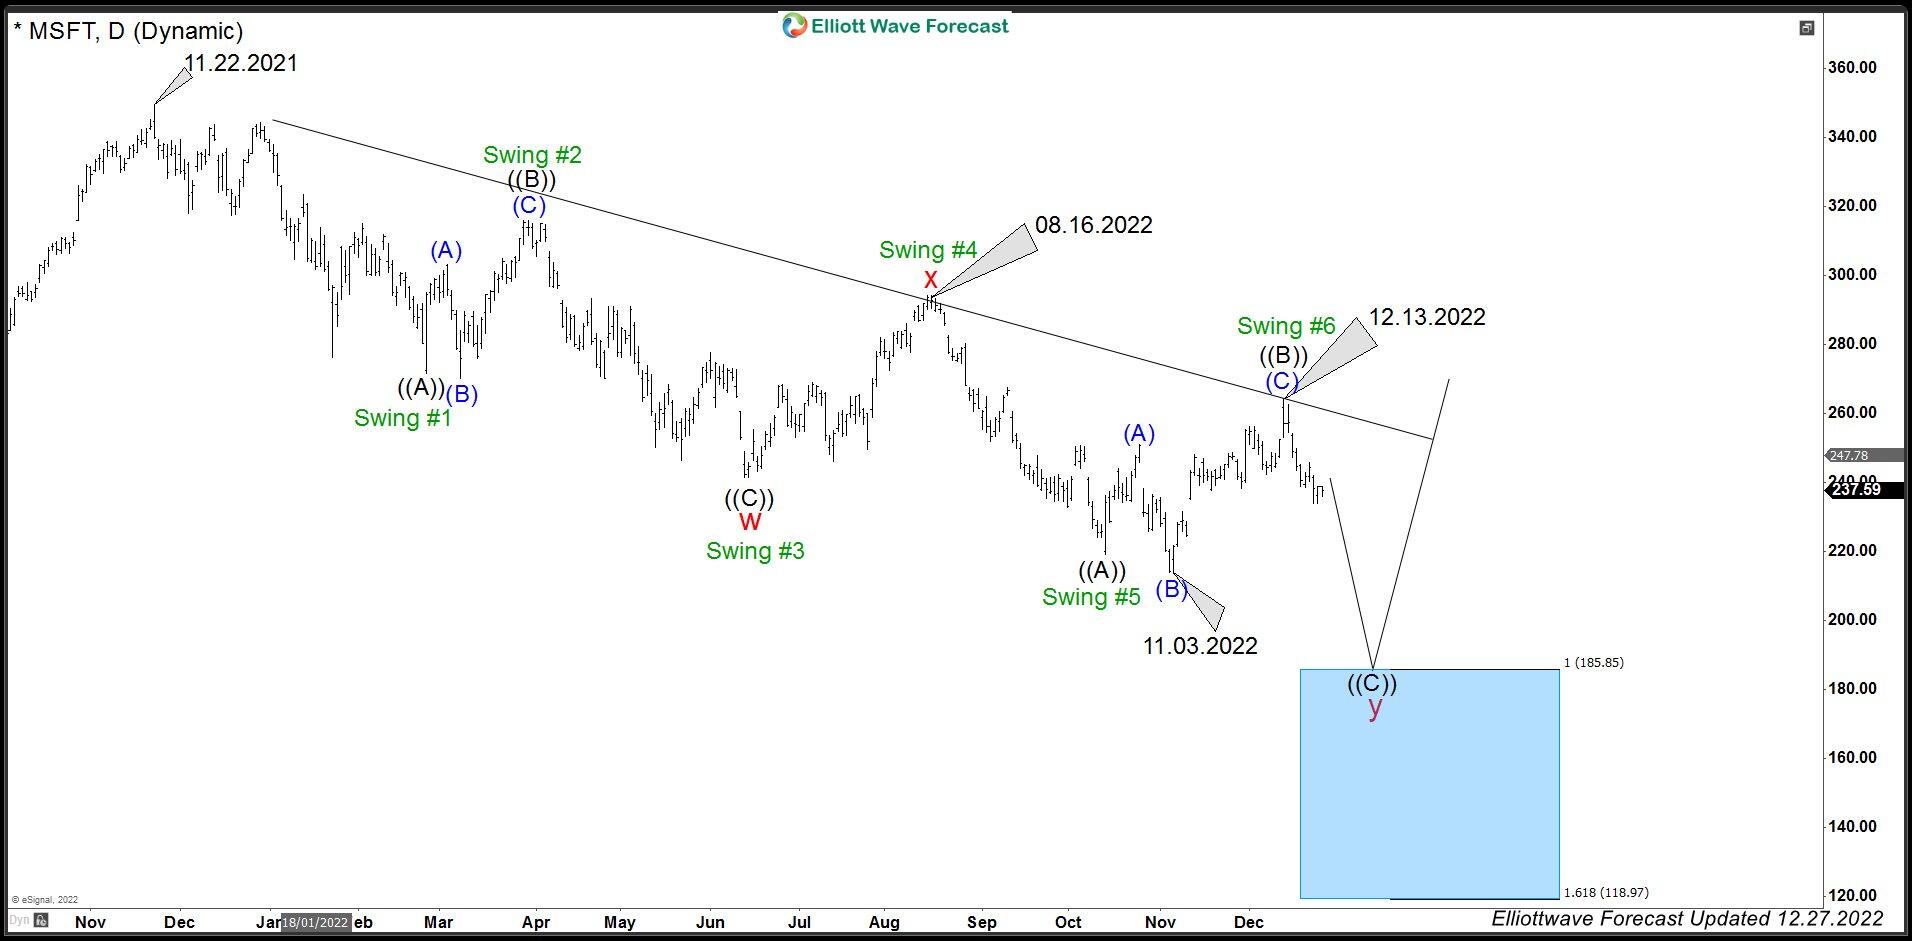
Microsoft (MSFT) daily Elliott Wave chart
MSFT

Daily Chart of MSFT (NASDAQ) shows that it has a bearish sequence from 11.22.2021 high. Structure of the decline is in a double three Elliott Wave structure. Down from 11.22.2021 high, wave ((A)) ended at 271.52 and wave ((B)) corrective bounce ended at 315.95. The stock then extended lower in wave ((C)) towards 241.51 which also completed cycle degree wave “w”. Wave “x” bounce ended at 294.18 and the stock has resumed lower. Wave “y” is now in progress and with a new low below wave “w”, there are now 5 swing down from the peak at 11.22.2021 and this makes it an incomplete sequence and calls for more downside towards 100% – 123.6% (185.85 – 118.97) area to complete 7 swing sequence. This is where buyers are expected to appear for a new leg higher or 3 waves rally at least.

Author

Elliott Wave Forecast Team

Elliott Wave Forecast Team

ElliottWave-Forecast.com

More from Elliott Wave Forecast Team
Share:

Editor's Picks

AUD/USD recovers toward 0.7000 amid improving mood

AUD/USD is firming up toward 0.7000 in Asia on Tuesday, helped by improving market mood. A pause in the US Dollar rebound also aids the pair's upside. However, geopolitical risks and caution ahead of AI tech earnings report could limit the pair.

USD/JPY flatlines near 158.50 as markets seek direction

USD/JPY steadies around 158.50 in the Asian trading hours on Tuesday. Traders prefer to wait on the sidelines ahead of Japan’s National Consumer Price Index inflation data later on Friday. Meanwhile, elevated US bond yields provide some support to the US Dollar against the Japanese Yen.

Gold just failed at $4,150. This is the next stop

Gold prices trade without a clear direction on Tuesday, hovering around the $4,170 region per troy ounce and still struggling to regain upside traction following Monday’s pullback. In the meantime, lower US Treasury yields and a marked pullback in the US Dollar come in tandem with the yellow metal’s price action.

Crypto Today: Bitcoin, Ethereum, XRP tick lower amid mixed ETF flows

Bitcoin is trading above $81,000 on Tuesday, aligning with a lethargic tone in the broader cryptocurrency market. Altcoins, including Ethereum and Ripple, reflect Bitcoin’s lock-step price action, trading below $2,400 and $1.30, respectively.

Markets at a turning point: Bitcoin, Gold, FX and Tech react to a heavy macro week

The new trading week opens with a mixed but revealing picture across global markets. Indices, commodities, FX, tech stocks, and cryptocurrencies are all sending one message: risk appetite is alive, but it is cautious, selective, and highly sensitive to macro signals.

The US Dollar fell. Gold didn't rally. That tells you everything
Gold (XAU/USD) is struggling to capitalize on a weaker US Dollar (USD), after repeatedly failing to establish itself above the $4,200 level. The precious metal remains confined to a relatively narrow trading range despite a combination of developments that would normally support higher prices.