|

Micron Technology Inc (MU) ended the cycle from December 2022 low

Micron Technology, Inc. (MU) designs, develops, manufactures, and sells memory and storage products worldwide. The company operates through four segments: Compute and Networking Business Unit, Mobile Business Unit, Embedded Business Unit, and Storage Business Unit.  Micron Technology, Inc. was founded in 1978 and is headquartered in Boise, Idaho.

MU weekly chart March 2023
MU

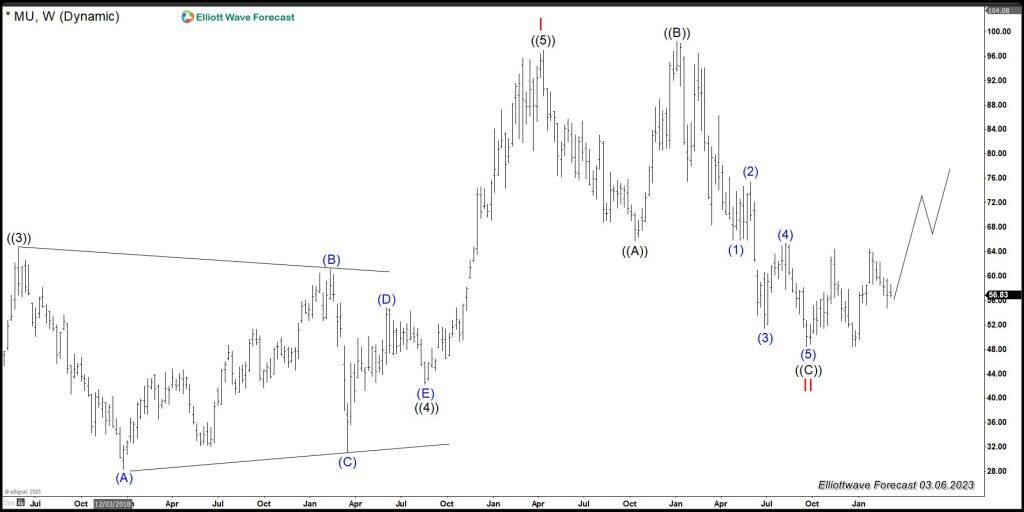
As we see in the chart above, we ended an impulse as wave I at $96.96 high. Then, the market did an expanded flat correction (3-3-5) causing the price to drop to $48.43. We labelled this low as wave II. From here, we expected to continue the rally as long as the price stays above wave II. (If you want to learn more about flat corrections, please follow these links: Elliott Wave Education and Elliott Wave Theory). 

MU weekly chart July 2024 
Chart

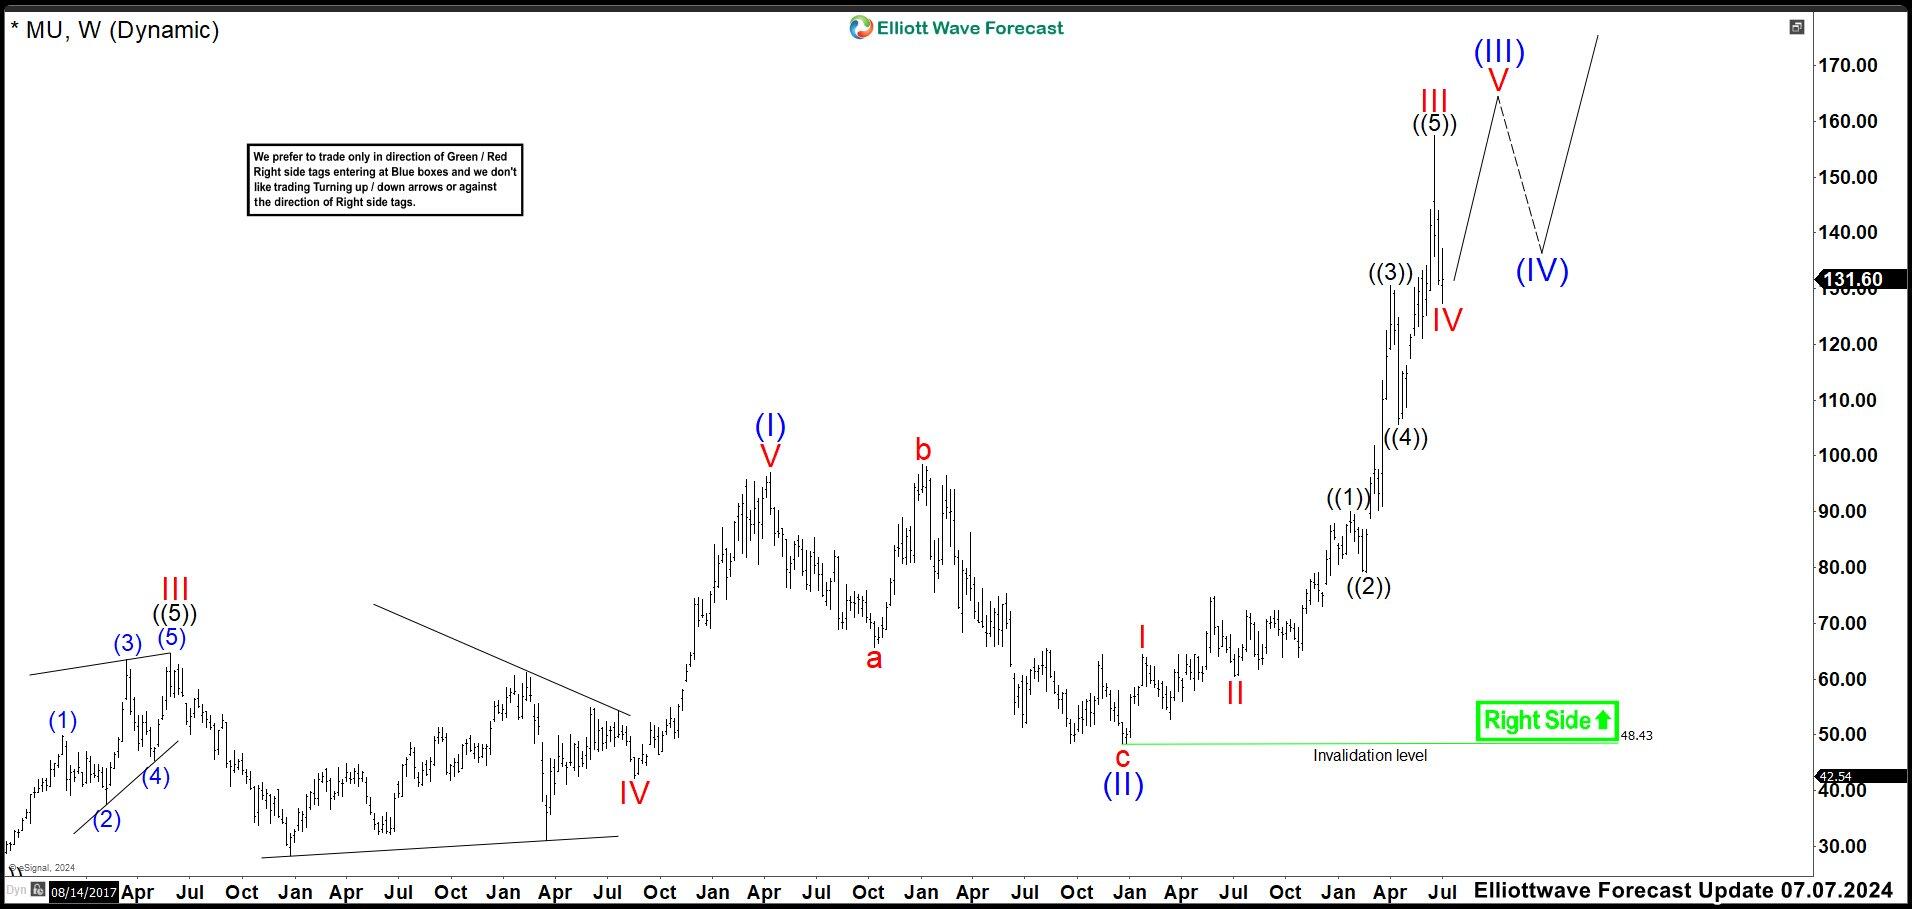
In July, we adjusted the labels by calling (I) and (II) where waves I and II were on the chart a year ago. As you could see, MU hit the bottom and started a new bullish cycle breaking above $150.00. This generated a return of more than 200% of the capital. We called a wave III of (III) at $157.54 high and wave IV ended at $127.27 low. We expected to trade higher in wave V of (III) to reach the ideal zone of $164.83 – $176.47 where we should see a market reaction.

MU weekly chart October 2024 
Chart

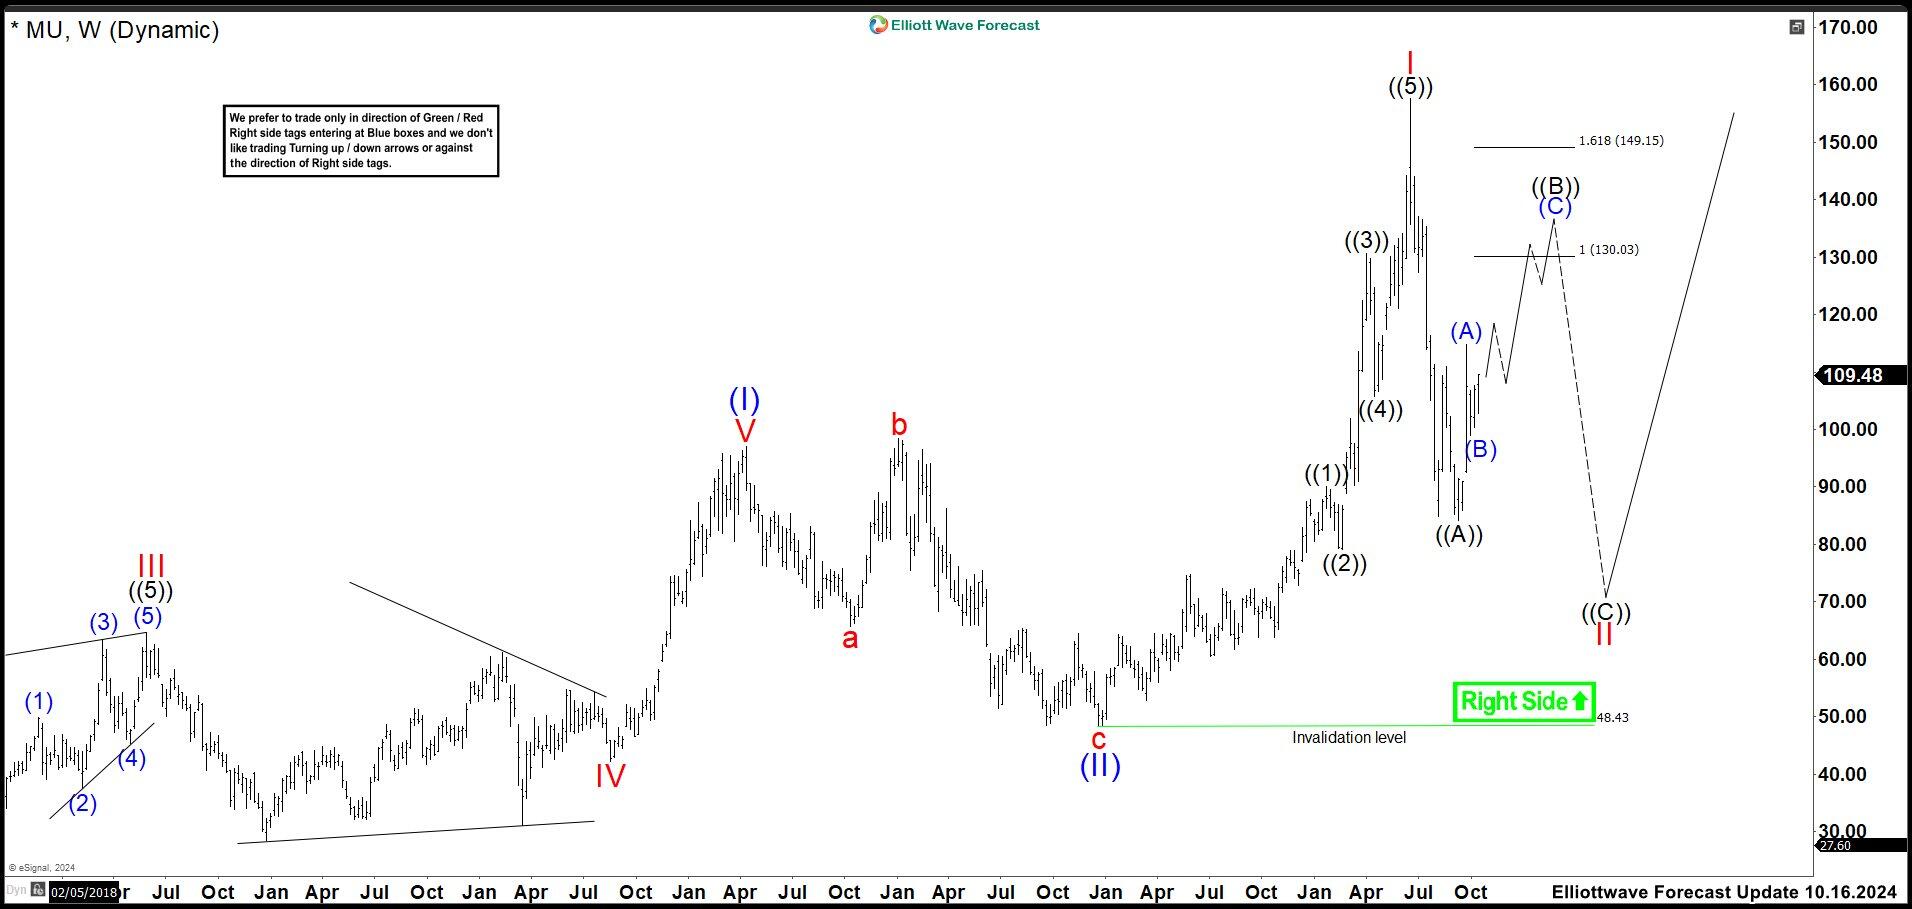
This is the latest update of Micron. Wave IV failed to withstand the market onslaught and broke below $127.27. This ended the cycle that started in December 2022 and we adjusted the movement as wave I of (III) ended at $157.57 high. MU did a bearish impulse ending at $84.12 low and we called it wave ((A)) of II. Currently, it is trading in the corrective wave ((B)). Wave (A) ended at $106.75 high. The correction ended wave (B) at $98.94 low. Now wave (C) has already started a new rally and we expect to reach the $130.03 – $149.15 area to culminate wave ((B)) and turn lower in ((C)). The idea is valid as long as the market stays below $157.57 or above $48.43. If the market breaks above wave I, then wave II is most likely over.

Author

Elliott Wave Forecast Team

Elliott Wave Forecast Team

ElliottWave-Forecast.com

More from Elliott Wave Forecast Team
Share:

Editor's Picks

GBP/USD gains traction above 1.3400 as softer US CPI dampens Fed rate hike expectations

The GBP/USD pair gains ground to near 1.3405 during the early Asian session on Wednesday. The US dollar weakens against the British Pound as softer-than-expected US inflation in June tempered expectations for US Federal Reserve policy tightening. The release of the US June Producer Price Index report will be in the spotlight later in the day. 

EUR/USD gathers strength above 1.1400 after soft US inflation data

The EUR/USD pair gains ground to near 1.1425 during the early Asian trading hours on Wednesday. The US Dollar weakens against the Euro as softer-than-expected US inflation data temporarily eased pressure on the Federal Reserve. Traders will take more cues from the US Producer Price Index report, which is due on Wednesday. 

Gold remains a ‘sell-on-rise’ trade amid US-Iran hostilities

Gold is resuming its downtrend toward two-week lows near $3,985 early Wednesday, following a temporary pullback seen on Tuesday, as there seems to be no end to the renewed hostilities between the United States and Iran concerning the Strait of Hormuz.

Hyperliquid representatives, Trade[XYZ] meet SEC Crypto Task Force to discuss digital asset regulation

The US Securities and Exchange Commission's Crypto Task Force met with representatives from the Hyperliquid Policy Center, XYZ Ltd., which operates Trade[XYZ] and Sullivan & Cromwell LLP to discuss regulatory approaches to digital assets, according to a memorandum released Tuesday.

2% and nothing else: Why Warsh gave Congress three hours of Greenspan

The Federal Reserve Chair who wants the institution to say less spent Tuesday legally required to say more, on the one morning the data handed him something pleasant to say. June's Consumer Price Index fell 0.4% on the month, the steepest single-month decline since April 2020.

Five sessions, one round trip: Why the whipsaw is exactly what Warsh ordered

Markets opened July with a December hike as the base case and spent five trading sessions unlearning and relearning it. A 57K payrolls print bled the tightening bets out of the strip; a re-shut Strait of Hormuz is pushing them back in. Wednesday's minutes from the June FOMC meeting landed mid-round-trip, describing a world that had already stopped existing.